Us2.ai - AI Software for Echocardiography
Model Version: v2
Revision: K
Medical Device
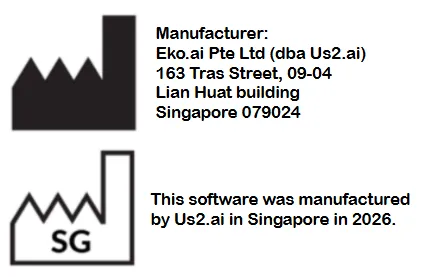
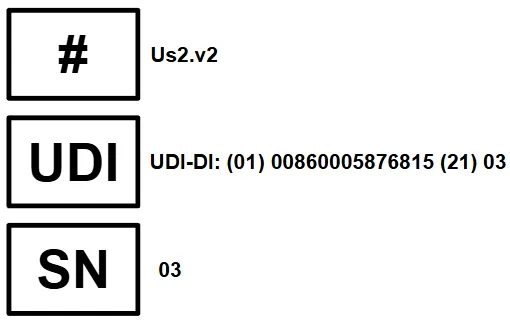
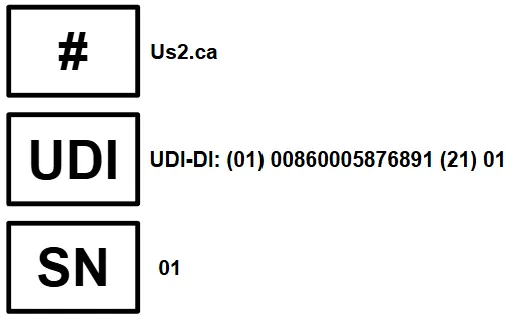
Table of Contents
1 Introduction
This document is the user guide for Us2.v2, a Software as a Medical Device designed by Us2.ai. It is recommended that you read this instruction manual carefully before use.
Us2.ai is a clinical decision support tool that analyzes echocardiogram images in order to generate a series of AI derived measurements. Fully automated, functional reporting with disease indications are also provided, in line with ASE & ESC guidelines.
Echo images are sent to the Us2.ai platform where they are processed, analyzed and measured. Results that meet the confidence threshold for both image quality and measurement accuracy are passed through to a report for review by the clinical users. Report text is also generated and presented with the measurements, providing functional reporting and disease indications.
Us2.ai greatly reduces user time spent creating manual measurements and allows clinical users to prioritize quality image acquisition and clinical time with patients.
Benefits
- No limitation on the number of users or echo scanner connections, with simple per exam pricing.
- Us2.ai processes DICOM image data and produces measurements in ~2 minutes.
- Removes/reduces the need for clinical staff to spend time measuring, increasing efficiency and throughput of patients.
- Eliminates operator variability, providing more accurate and consistent results than humans.
- Custom measurements can be made using the intuitive user interface.
- Image viewer is integrated into the web application and linked to the measurements, which makes reviewing images and measurements a single click.
- Results and measurements can be sent to EHR, PACS, CVIS as discrete measurements (HL7, CSV, DICOM SR, Encapsulated PDF) or stored as a formatted PDF report for review/signature/approval.
- All data is standardized and structured in a single DICOM SR format regardless of the source echo machine.
1.1 Abbreviations
A: area
A2C: Apical 2-chamber
A3C: Apical 3-chamber
A4C: Apical 4-chamber
A5C: Apical 2-chamber
A-L: Area-Length
Ao: Aorta
AV: Aortic Valve
CO: Cardiac Output
CW: Continuous-Wave
d: diastole
DecT: Deceleration Time
i: indexed for body surface area
ID: Internal Diameter
Echo: Echocardiogram
EDV: End-Diastolic Volume
EF: Ejection Fraction
ESV: End-Systolic Volume
IVS: Inter-Ventricular Septal
L: Length
LV: Left Ventricular
MOD: Method of Discs
MV: Mitral Valve
OT: Outflow Tract
PLAX: Parasternal Long Axis
Pmax: Maximum Pressure gradient
PW: Posterior Wall
RA: Right Atrium
RV: Right Ventricle
RWT: Relative Wall thickness
RWMA: Regional Wall Motion Abnormality
s: systole
TAPSE: Tricuspid Annular Plane Systolic Excursion
TR: Tricuspid Regurgitation
Vmax: Maximum Velocity
W: Width
1.2 Intended Use
Us2.v2 software is used to process acquired transthoracic cardiac ultrasound images, to analyze and make measurements on images in order to provide automated estimation of several cardiac structural and functional parameters, including left/ right atrial and ventricular linear dimensions, volumes, systolic function and diastolic function, measured by B mode, M mode and Doppler (PW, CW, tissue) modalities. The data produced by this software is intended to be used to support qualified cardiologists, sonographers, or other licensed professional healthcare practitioners for clinical decision-making. Us2.v2 is indicated for use in adult patients.
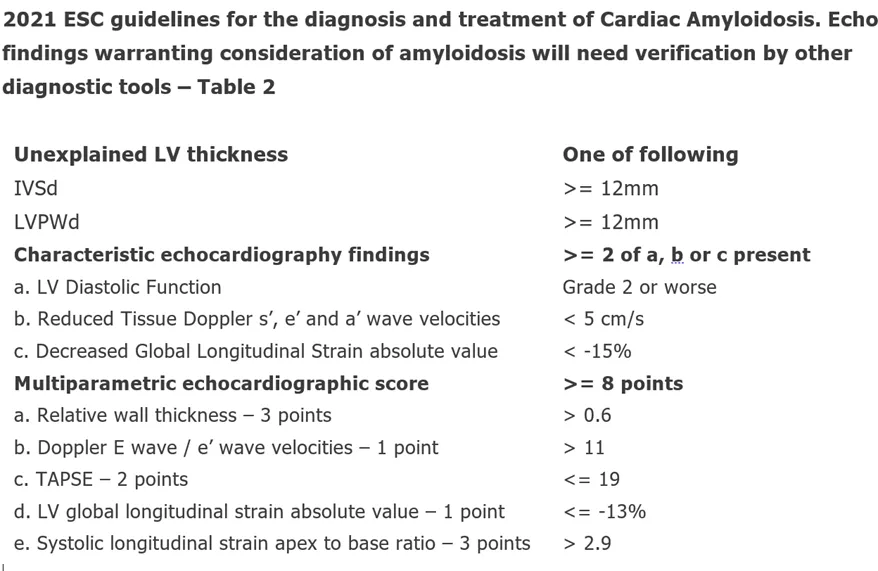
1.2.1 Cardiac Amyloidosis Add-on module
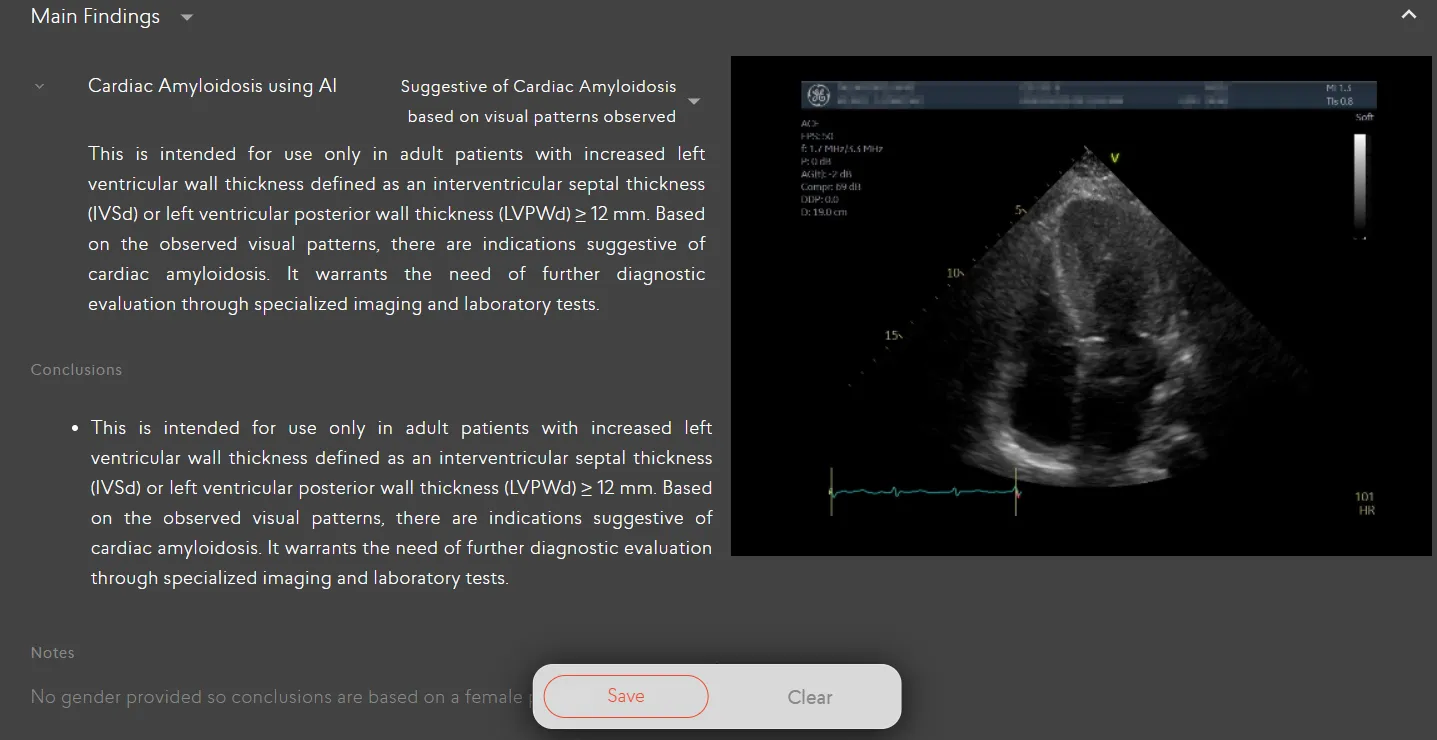
Us2.ca processes acquired transthoracic cardiac ultrasound images to support qualified cardiologists, sonographers, or other licensed professional healthcare practitioners in their diagnosis of cardiac amyloidosis. Us2.ca is intended for use only in adult patients with increased left ventricular wall thickness, defined as an interventricular septal thickness (IVSd) or left ventricular posterior wall thickness (LVPWd) ≥ 12mm. Us2.ca is not intended to provide a diagnosis and does not replace current standards of care. The results from Us2.ca are not intended to exclude the need for further follow-up on cardiac amyloidosis.
1.3 Contraindications and Limitations
Because Us2.v2 measurements cover the minimum echocardiographic dataset for a standard adult echocardiogram (by European Society of Cardiovascular Imaging, British Society of Echocardiography and American Society of Echocardiography guidelines), our software is applicable to the vast majority of adult transthoracic echocardiograms.
Our current software aims to automate measurements of cardiac dimensions and left ventricular function and are applicable regardless of normal or disease states. We specifically indicate that our current product will not be reporting measurements associated with intra-cardiac lesions (e.g. tumours, thrombi), nor complex adult congenital heart disease.
Please note the following additional limitations:
- Poor image capture will lead to poor annotations and subsequent measurements. Multiple image quality algorithms are used to filter out images of poor quality.
- Our software complements good patient care and does not exempt the user from the responsibility to provide supervision, clinically review the patient, and make appropriate clinical decisions.
- If no gender is present, female referenced guideline values will be used for conclusions.
- If Body Surface Area (BSA) is not present, indexed values cannot be provided.
- Normal reference values vary with age, sex, and In case of doubt always refer back to the appropriate cardiac society's guidelines.
- During image acquisition, inappropriate use of the echo machine, use of non- cardiac ultrasound probes, use of suboptimal settings (e.g. gain, contrast, depth), or lack of EKG capture may lead to lower accuracy of the software.
- Us2.ca does not identify regions of interest or areas of possible pathology in the images.
- Us2.ca does not differentiate different types of Cardiac Amyloidosis e.g. ATTR, AL etc.
- Us2.ca was externally validated on cardiac images from GE and Philips ultrasound systems. Use of the device on ultrasound systems other than GE and Philips may lead to lower accuracy of the software.
1.4 Clinical Benefits
Us2.v2 is an image post-processing analysis software device used for viewing and quantifying cardiovascular ultrasound images in DICOM format. The device is intended to aid diagnostic review and analysis of echocardiographic data, patient record management and reporting.
The primary intended function of Us2.v2 is to automatically provide clinically relevant and reproducible quantitative echocardiographic measurements, while reducing echocardiographic analysis time. In doing so, the primary benefit of Us2.v2 is to improve clinical echocardiographic workflow, enabling clinicians to generate and edit reports faster, with precision and with full control.
Today, the clinical workflow of a sonographer is as follows:
- The sonographer performs the echocardiography exam (“echo exam”) to capture the images/videos.
- The specialist sends the images/videos to a server for picture archiving and communication system (PACS).
- Another specialist retrieves the images/videos from the PACS and downloads them onto a local workstation to then:
- Review the images/videos. Manually determine which view has been captured.
- Manually determine the cardiac structures imaged within the captured view.
- Manually segment and draw annotations on the region of interest (ROI) in order to perform measurements.
- Manually refer to standard reference guidelines to determine if any of the potentially dozens of measurements performed fall within the normal range of values for that patient’s sex or ethnicity.
- Manually create a report based upon the conclusions drawn from the measurements.
This process can be prone to human error, and is more importantly time-consuming, placing a rate on the number of exams that can be processed within a given unit of time.
The goal of Us2.v2 is to simplify much of this process through machine learning based automation, so that the workflow becomes:
- The sonographer performs the echo
- The sonographer sends the images/videos to a PACS
- Us2.v2 retrieves the images/videos from the PACS and processes them, allowing a sonographer to then:
- Review the report which has already highlighted measurements that fall outside of normal ranges.
- Review the original images/videos, if desired.
- Manually adjust any of the automated segmentations and measurements if desired.
1.4.1 Enhanced Echocardiographic Reporting: Balancing Automated Analysis with Manual Review
While the software does not require human intervention to automatically produce a full report, the software provides an interface for a skilled sonographer/ reviewing physician to perform edits/ revise the markup on the echocardiographic image measurement if needed. The markup includes: the cardiac segments captured, measurements of distance, time, area and blood flow, quantitative analysis of cardiac function, and a summary report.
The software allows the sonographer to enter their markup manually. It also provides automated markup and analysis, which the sonographer may choose to accept outright, to accept partially and modify, or to reject and ignore. Machine learning based view classification and border detection form the basis for this automated analysis. Additionally, the software has features for organizing, displaying and comparing to reference guidelines the quantitative data from cardiovascular images acquired from ultrasound scanners.
3 Installation
Us2.ai is available as a cloud service, installed on premises (hard server or suitable VM), or on a high end tablet, laptop or workstation, for direct connected offline use. Workflows are fully configurable, the software can be interfaced and integrated with any combination of echo scanners and PACS/EMR/reporting packages.
Us2.ai comes in two configurations:
3.2 On-Premises workflows
The Us2.ai on-premises software application is used to process DICOM images from multiple echo scanners within the local hospital network, automatically generating measurements and report text, which can then be forwarded to the PACS, reporting system or EMR. Patient data never leaves the site, nor is accessible outside of the network (unless specifically requested and data sharing is enabled by an administrator).
Us2.ai software can also be used entirely on the local network, installed in customer provided servers (VM or hardware), on a NUC server provided by Us2.ai, or on a standalone tablet, laptop, or workstation.
Multiple echo scanners and multiple clients (clinical users accessing via browser) can connect concurrently to a single instance.
3.2.1 Common on-premises workflows
3.2.1.1 Direct send from echo scanners (preferred)
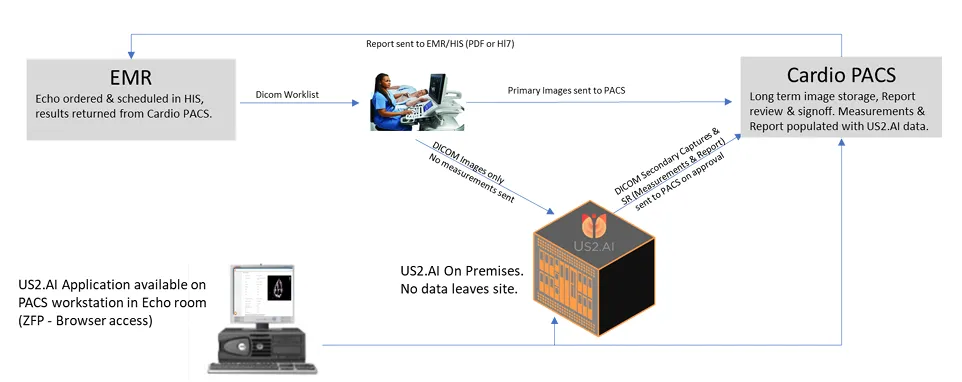
- Exams performed as usual, but no need for manual measurements.
- Images are “sent on acquire” to both the PACS and the Us2.ai server as they are stored during the exam.
- Us2.ai measures and analyzes in real time, finalizing a complete report while the patient is still present.
- Browser based access to the Us2.ai app allows users to review and approve measurements. The full patient report and measured images are available on the workstation in the echo room, on a tablet next to the echo machine, or on any suitable device on the network (PC in cardiologist office, remote view from mobile devices, etc.).
3.2.1.2 Images managed by PACS
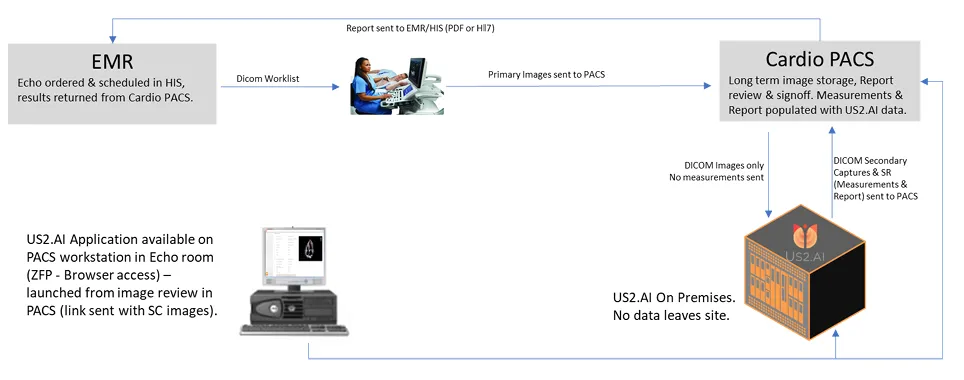
- Exams performed as usual, but no need for manual measurements.
- Images are sent to the PACS as usual and appropriate studies are forwarded to the Us2.ai server.
- Us2.ai measures and analyzes the images, returning results to the PACS in ~2 minutes.
- Browser based access to the Us2.ai app is available to review results and can be launched from the PACS via direct link sent with secondary captures (if this feature is available in the PACS).
3.2.1.3 Server requirements for on-premises
(NUC supplied by Us2.ai, VM or hard server provided by local IT)
Platform
- Ubuntu 18+ (preferred)
- Debian 10+
- CentOS 7+
- Amazon Linux 2
- Windows 11 Pro
Processor
- 16 cores or more
RAM
- 64 GB or more
Storage (suggested)
- OS Drive: 1TB SSD (NVME preferred)
- Data Drive: 1Tb per 1k echo exams to be stored
GPU (physical GPU required on VM)
- Min 12GB GPU (i.e. RTX 4070 or higher) dedicated GPU required for VM.
Static IP address
Ports
- inbound 11113
- outbound 443
- plus any ports used to send to onsite PACS/EMR (defined by the PACS manager)
Security & Backups
- For demonstration and loan systems CrowdStrike is installed. Local IT can install alternatives in line with local policies. Backups can be managed in line with local policies.
3.2.1.4 Installation for on-premises
For Us2.ai provided hardware, the system will arrive preinstalled. Us2.ai engineers will require remote access to finalize the installation.
For a local IT supplied hard server or virtual machine, installation will proceed as follows:
- Local IT will install the operating system and suitable GPU drivers, and set a static IP address.
- Us2.ai will provide a download link for a site specific software bundle.
- Local IT will provide an agreed method for Us2.ai to have secure remote access.
- Us2.ai engineers will remotely install the Us2.ai application within Docker, isolating the Us2.ai application from the OS. The install will contain all required libraries, system tools, and runtime code. This process minimizes IT input and resources required for the deployment.
- Local IT will provide details for any SSO/SAML/Active Directory integration.
- Local IT will agree a URL for client access. The local DNS can be used for addressing. If no local DNS is available, Us2.ai can provide and manage a secure ####.Us2.ai domain.
- Outbound export to a local PACS/EMR can be defined on installation, or added at a later date via an administrator login to the web interface.
- Once deployed, the installation will be verified and tested by Us2.ai engineers, with assistance from local IT.
- The Us2.ai application software runs a DICOM router as a DICOM SCP which can be set up as a DICOM server destination on echo machines:
- The following details will be entered as the destination on the echo machines:
- IP address of Server hosting the Us2.ai application
- AE Title: Us2.ai
- Port: 11113
- Set the echo machines to export 30 frames per second or greater (full frame rate is preferred for stress analysis)
- JPEG compression can be used
- DICOM SR can be sent to Us2.ai if user generated measurements are also to be viewed within the Us2.ai application
- The following details will be entered as the destination on the echo machines:
The DICOM router uses MP4 compression to greatly reduce file sizes prior to processing. This may not be compatible with some PACS systems. If source DICOM images are required to be exported from Us2.ai in the future, please request that this is disabled on installation (i.e., if Us2.ai on premises is your primary image storage). In most cases, source DICOM images have already been sent to a PACS and will not need to be exported from Us2.ai.
Installation instructions: installation may be only realized by technicians of Us2.ai.
4 Getting Started
4.1 Login
Using your user login credentials that you will have received separately, use your browser and navigate to https://app.us.Us2.ai/ to login.
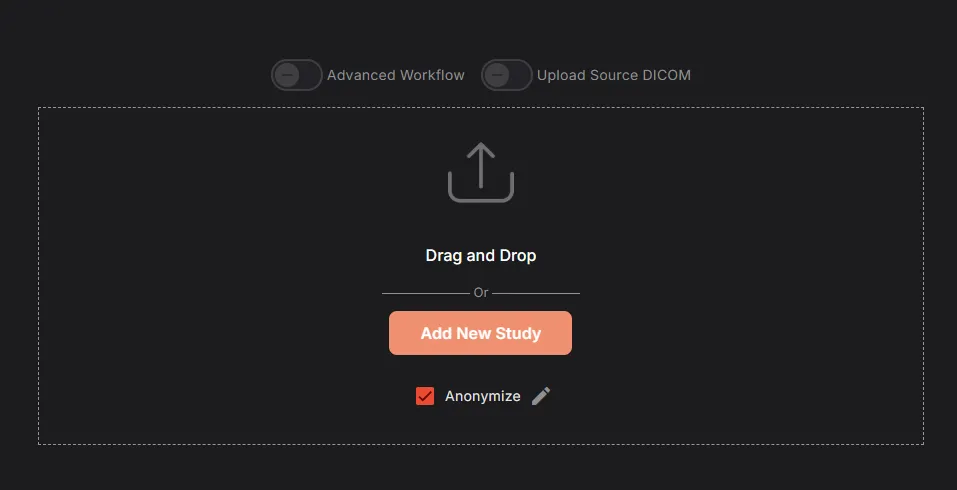
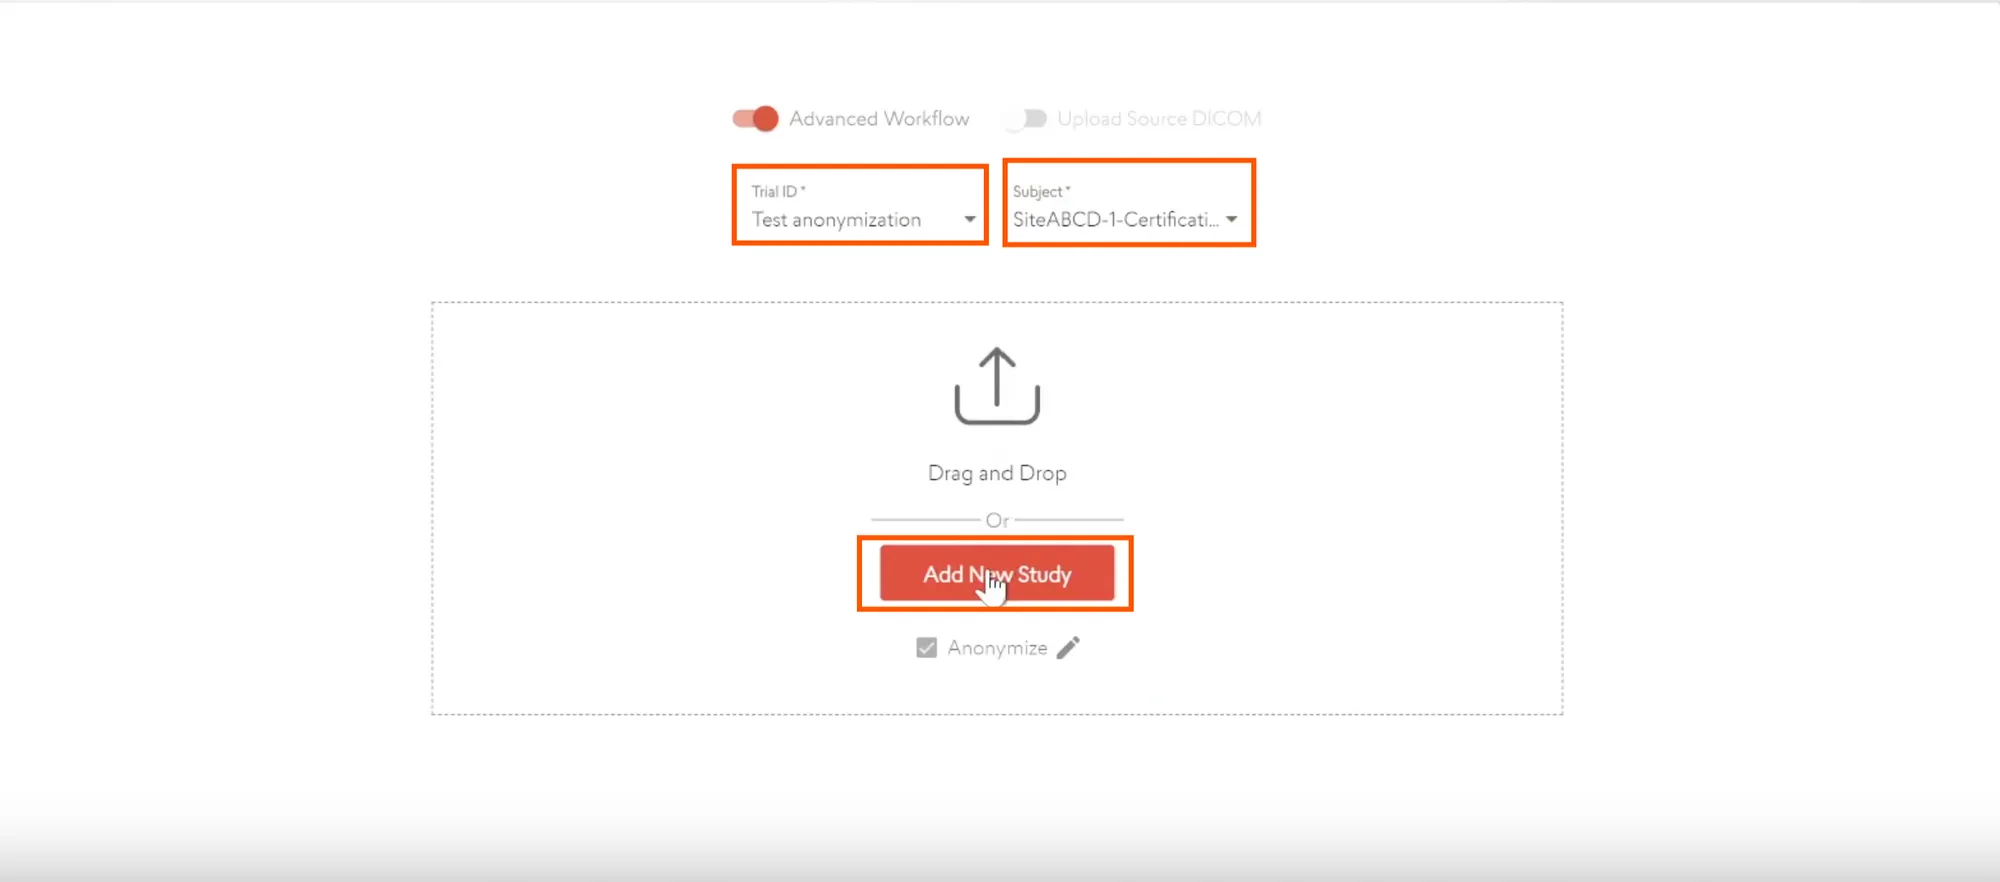
4.2 Echoloader
- Select the "EchoLoader" option. Note only DICOM format studies are supported.
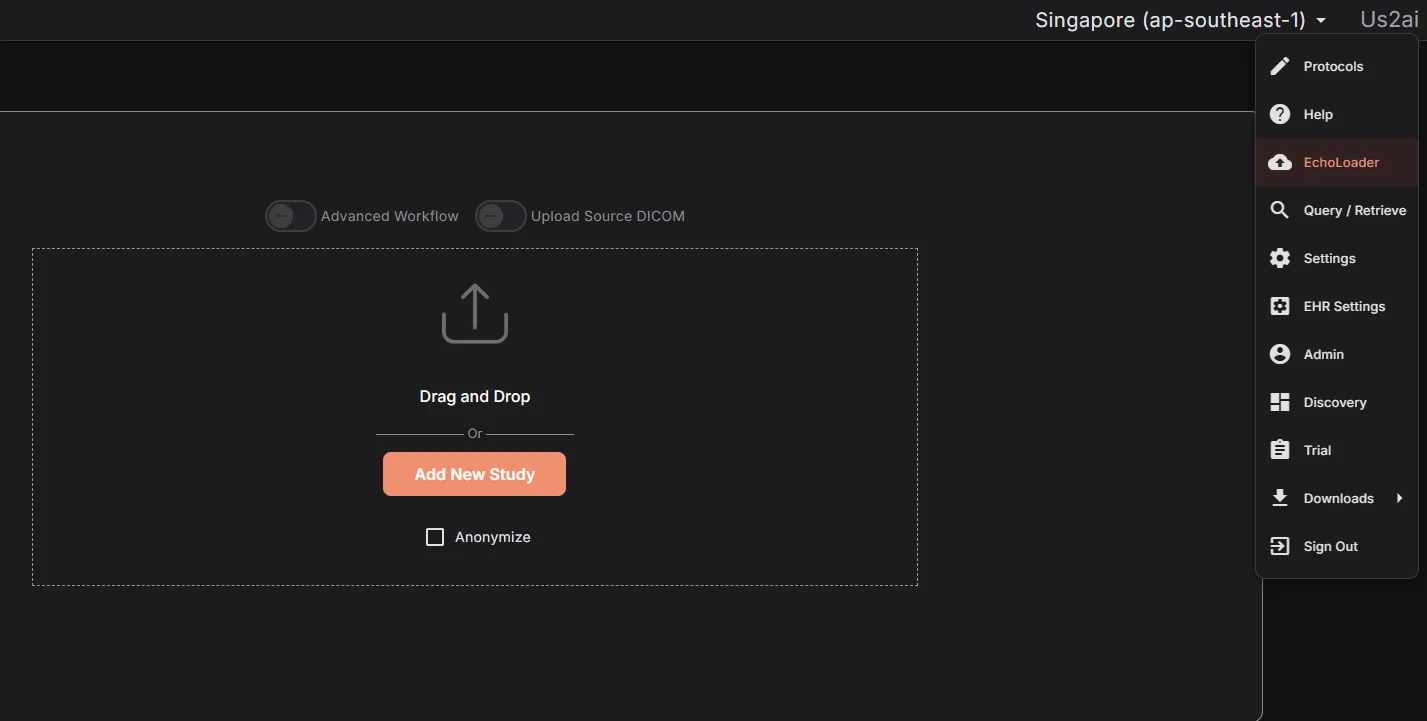
- Click on Browse Files to locate the echo studies you would like to analyze, or simply drag and drop them into the browser window.
- Click the Anonymize checkbox to remove patient identifiers from the processed files.
- Once your files have been added, you will be given the chance to approve them before they are processed (in the cloud or on premises). The original DICOM files are stripped of the majority of their information, images cropped to remove any potential identifiers, and DICOM metatags removed, except for those required by the software.
- The following DICOM metatags are always used:
- AccessionNumber
- AcquisitionDate
- AcquisitionDateTime
- AcquisitionTime
- ClinicalTrialProtocolID
- ClinicalTrialProtocolName
- ClinicalTrialSubjectID
- ContentDate
- ContentTime
- InstanceNumber
- InstitutionName
- Manufacturer
- ManufacturerModelName
- Modality
- PatientAge
- PatientSex
- PatientSize
- PatientWeight
- ReadingPhysician
- ReferringPhysician
- SeriesDate
- SeriesInstanceUID
- SeriesNumber
- SOPClassUID
- SOPInstanceUID
- StudyDate
- StudyDescription
- StudyID
- StudyInstanceUID
- StudyTime
- ViewNumber
- ViewName
- TransferSyntaxUID
- StageNumber
- StageName
- SequenceOfUltrasoundRegions
- SegmentedRedPaletteColorLookupTableData
- SegmentedGreenPaletteColorLookupTableData
- SegmentedBluePaletteColorLookupTableData
- SamplesPerPixel
- Rows
- RedPaletteColorLookupTableDescriptor
- RedPaletteColorLookupTableData
- RecommendedDisplayFrameRate
- PlanarConfiguration
- PixelRepresentation
- PhotometricInterpretation
- NumberOfStages
- NumberOfFrames
- HighBit
- HeartRate
- GreenPaletteColorLookupTableDescriptor
- GreenPaletteColorLookupTableData
- FrameTime
- EffectiveDuration
- Columns
- CineRate
- BluePaletteColorLookupTableDescriptor
- BluePaletteColorLookupTableData
- BitsStored
- BitsAllocated
- The following DICOM metatags are used when anonymization is turned off:
- PatientBirthDate
- PatientID
- PatientName
Prior to uploading, you will be able to remove, pseudonymize for each of the respective metatags by clicking on the ‘Edit’ button beside the Anonymize checkbox.
After you have approved the images, the upload will start following a predefined workflow based on the mode of installation.
- Cloud: A pre-signed URL will be created and used to upload to the AWS s3 bucket
- On-Prem: Upload will be performed directly to an upload URL
Upon completion of the upload, the automated analysis will be triggered based on the uploaded DICOM images and reflected on the search page as the processing finalizes.
Echos must be in the standard DICOM format and can be loaded from your local computer or a network For connections to a PACs server or custom EHR integrations, please contact Us2.ai (see Manufacturer section at the end of this document)
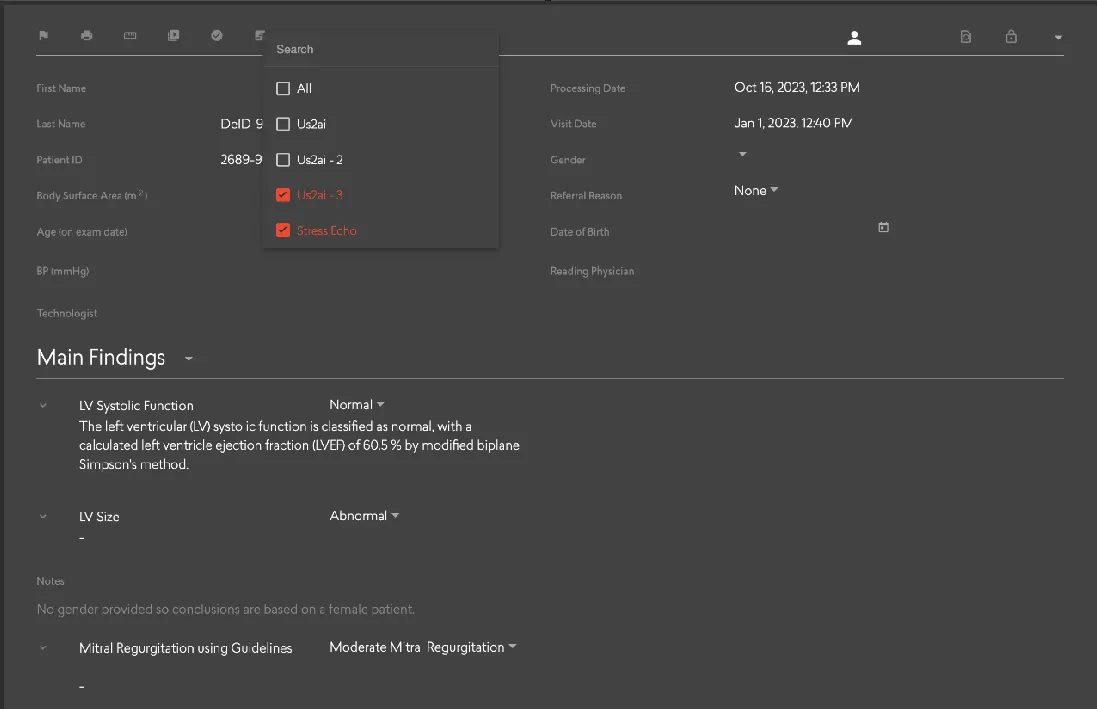
4.3.2 Simple/Advanced Search filter option
- Use Simple Search Tools at the top of the page to search by identifiers and common attributes, such as last name, first name, patient ID, date of birth, exam date, trial, approved/completed reports, flagged studies, and similar fields.
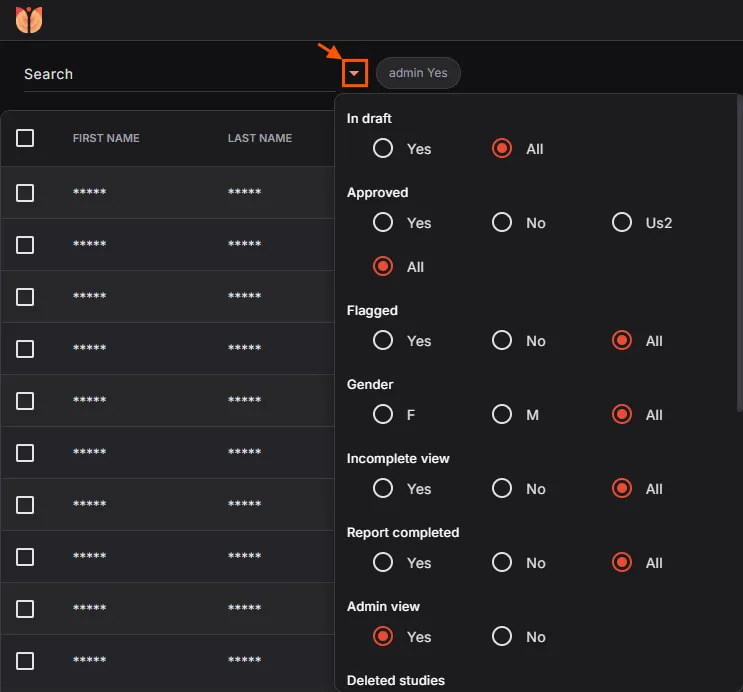
- Open the Advanced Search Tools panel to filter by clinical and report parameters, such as conclusions, LV and RV function/size, atrial size, heart failure, pulmonary hypertension, referral reason, LVEF, and LV E/e’.
More Advanced Search Tools are also available to locate studies by specified search criteria. You can search for studies using:
- Conclusions
- LV Systolic Function
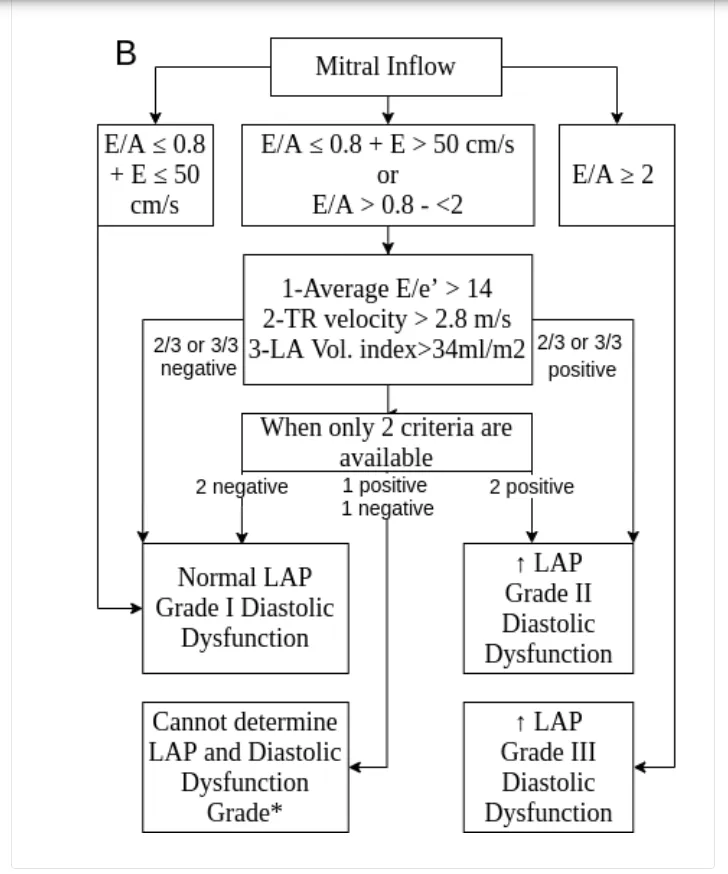
- LV Diastolic Function
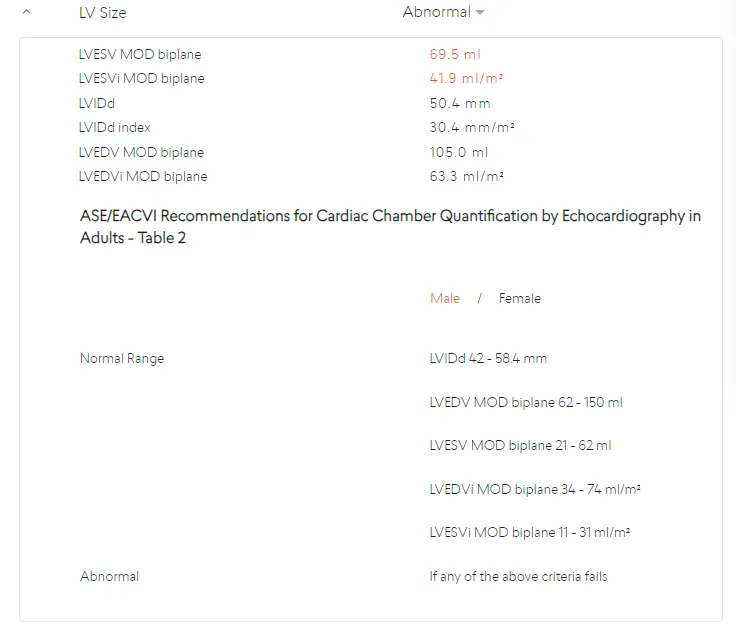
- LV Size
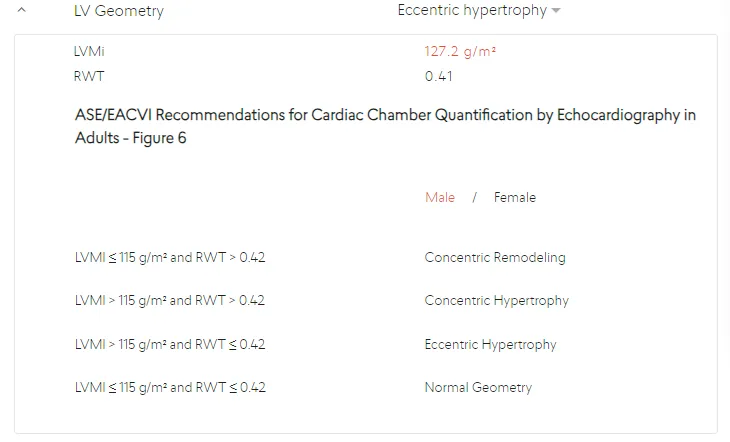
- LV Geometry
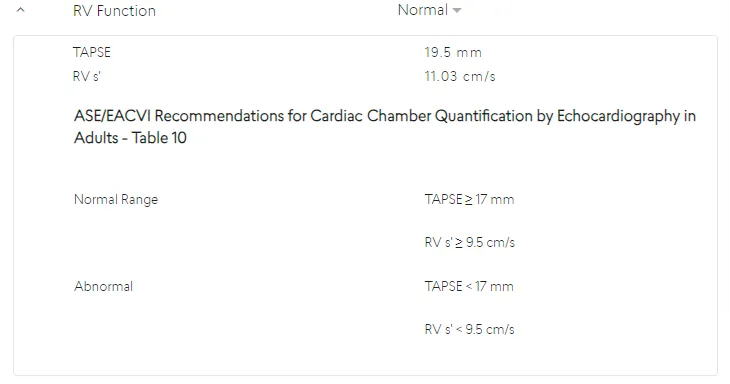
- RV Function
- RV Size
- LA Size
- RA Size
- Aortic Stenosis
- Pulmonary Hypertension
- Heart Failure
- Cardiac Amyloidosis
- Cardiac Amyloidosis using AI
- Stress Echo
- Referral reason
- Trial (if applicable)
- Measurements
Radio buttons, toggles, text entry fields, dropdown selectors and date pickers are implemented using their respective Angular Material components. The Advanced Search options are contained within an Angular Material expansion panel.
The search page also offers a paginated search result overview, that allows the user to navigate to any report that matches their search criteria.
4.3.3 Sync
On page load, the Search Component uses the Sync Service to search parameters such as databases available, and referral reasons.
4.3.4 Refresh
The search results are periodically updated to keep the search results in sync with changes from other users or automated analysis.
4.3.5 Navigate
Clicking a row in the Search Result component will navigate to the report clicked. On click, the URL is changed to the report page, with the parameters associated with the row included. The URL is also encoded with information from the original search. This allows navigation between reports on the report page, based on the search parameters.
Studies can also be viewed using mobile device browsers or via the Us2.ai app available on Android. Please contact your account representative for access.
4.4 Viewing patient reports
The Report page displays patient reports in 2 panels,
- Detailed list of patient information, notes and automated findings based on International Cardiology guidelines. A video containing a moving chamber segmentation will be included if available.
By selecting the patient ID from the dropdown list triggered by clicking on the Select Patient icon, the report reloads with information from the selected patient. The arrow buttons may also be used to navigate to next and previous patients.
- List of all measurements provided in the patient report, grouped by their respective headings with abnormal measurements displayed in red.
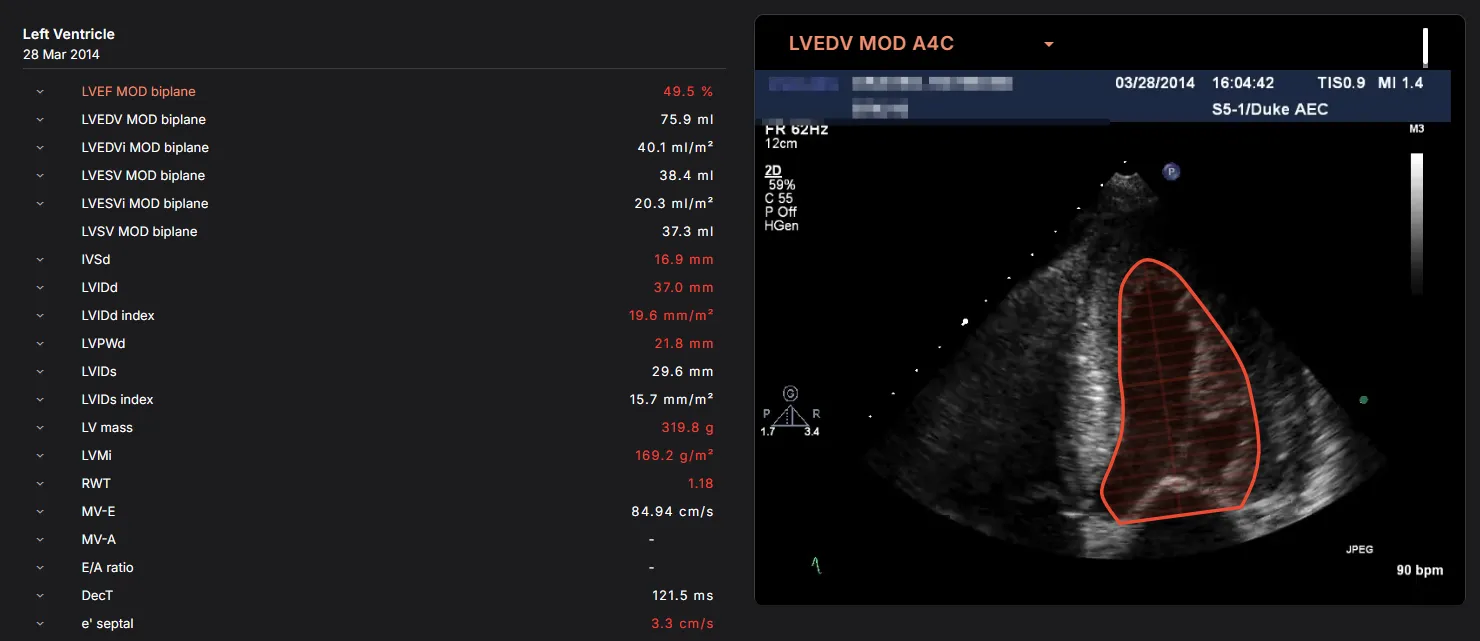
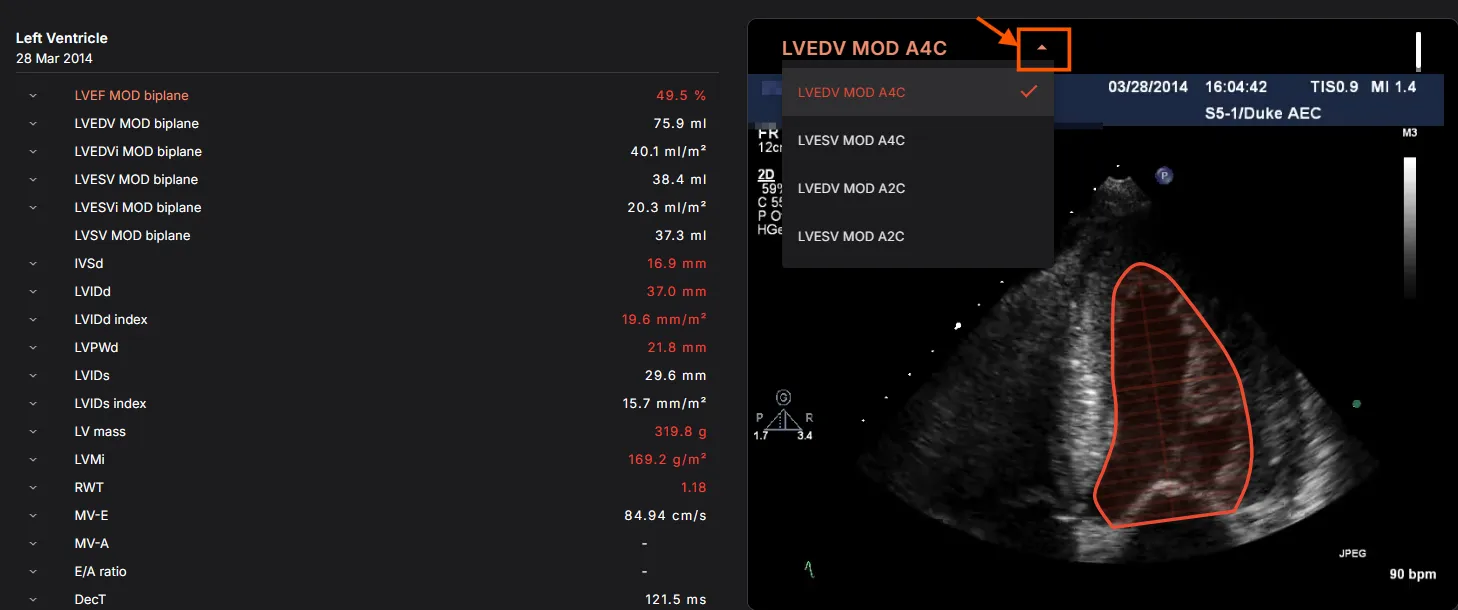
- Hovering over the measurements displayed in the report, the dependencies for that measurement are parsed and then passed into the preview component which displays the measurement on the custom editor canvas. If dependencies passed in consists of an array of derived measurements, the dropdown in the preview box will list all of the dependent measurements. If there is more than one value for a particular measurement, the top shopper for all measurements will be displayed, and an option to preview the rest will present itself as radio buttons. Each measurement displayed in the report is linked to the measurement URL to access the measurements page where edits may be applied.
Or, if using a mobile device, you can tap swipe to navigate through the Report sections.
4.4.1 Primary Measurements
The following measurements are available:
| S/N | Measurement | Description |
|---|---|---|
| 1 | LVEF MOD Biplane | Left Ventricular Ejection Fraction calculation based on Method of Disks |
| 2 | LVEDV MOD Biplane | Left Ventricular End Diastolic Volume biplane calculation based on Method Of Disks |
| 3 | LVESV MOD Biplane | Left Ventricular End Systolic Volume biplane calculation based on Method Of Disks |
| 4 | LVSV MOD Biplane | Left Ventricular Stroke Volume biplane calculation based on Method Of Disks |
| 5 | LAESV MOD Biplane | Left Atrial End Systolic Volume biplane calculation based on Method Of Disks |
| 6 | RA Area | Right Atrial area at end systole |
| 7 | RVIDd | Right Ventricular Internal Diameter at end diastole |
| 8 | LVIDd | Left Ventricular Internal Diameter at end diastole |
| 9 | LVIDs | Left Ventricular Internal Diameter at end systole |
| 10 | LVPWd | Left Ventricular Posterior Wall thickness at end diastole |
| 11 | IVSd | Inter Ventricular Septal thickness at end diastole |
| 12 | PWTDI lateral e’ | Early diastolic tissue velocity taken from the lateral wall of LV |
| 13 | PWTDI lateral a’ | Late diastolic tissue velocity taken from the lateral wall of LV |
| 14 | PWTDI lateral s’ | Systolic tissue velocity taken from the lateral wall of LV |
| 15 | PWTDI septal e’ | Early diastolic tissue velocity taken from the septal wall of LV |
| 16 | PWTDI septal a’ | Late diastolic tissue velocity taken from the septal wall of LV |
| 17 | PWTDI septal s’ | Systolic tissue velocity taken from the septal wall of LV |
| 18 | PWMV E | Pulse wave velocity of early diastolic transmitral flow |
| 19 | PWMV A | Pulse wave velocity of late diastolic transmitral flow |
| 20 | PWMV DecT | Deceleration Time of early diastolic MV transmitral flow |
| 21 | PWMV ADur | Late diastolic transmitral flow |
| 22 | E/e’ mean | E/e’ mean |
| 23 | CW TrV Vmax | Continuous wave of tricuspid regurgitation maximum velocity |
| 24 | LV GLS | Left ventricular global longitudinal strain |
| 25 | A4C LV GLS | Left ventricular global longitudinal strain in A4C |
| 26 | A3C LV GLS | Left ventricular global longitudinal strain in A3C |
| 27 | A2C LV GLS | Left ventricular global longitudinal strain in A2C |
| 28 | LV Regional Strain | LV Regional Strain |
| 29 | TAPSE | Tricuspid annular plane systolic excursion |
| 30 | RV E ‘ | Early diastole tissue velocity taken from right ventricular free wall |
| 31 | RV A’ | Late diastole tissue velocity taken from right ventricular free wall |
| 32 | RV S’ | Systolic tissue velocity taken from right ventricular free wall |
| 33 | Sinotubular Junction | Sinotubular Junction diameter |
| 34 | Sinus valsalva | Sinus of valsalva diameter |
| 35 | LVOT Diameter | Left ventricular outflow tract diameter |
| 36 | CW AoV Vmax | Continuous wave aortic valve maximum velocity |
| 37 | CW AoV VTI | Continuous wave aortic valve velocity time integral |
| 38 | CW AoV Pmax | Continuous wave aortic valve maximum pressure |
| 39 | CW AoV Pmean | Continuous wave aortic valve mean pressure |
| 40 | PW LVOT Vmax | Pulse wave left ventricular outflow tract maximum velocity |
| 41 | PW LVOT VTI | Pulse wave left ventricular outflow tract velocity time integral |
| 42 | PW LVOT Pmax | Pulse wave left ventricular outflow tract maximum pressure |
| 43 | PW LVOT Pmean | Pulse wave left ventricular outflow tract mean pressure |
| 44 | AVA | Aortic valve area |
| 45 | VR | Velocity ratio |
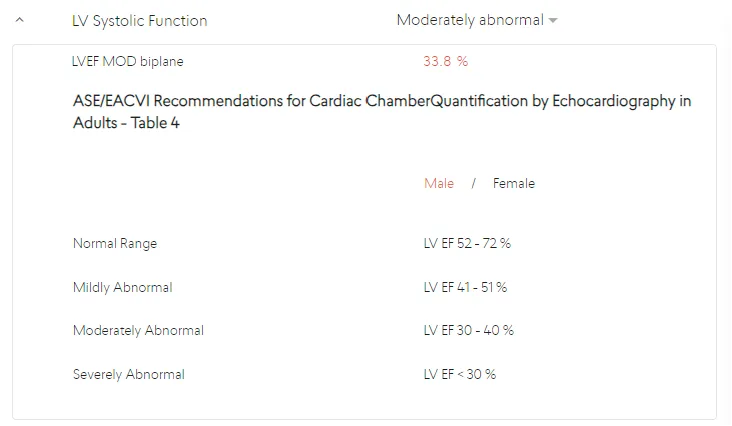
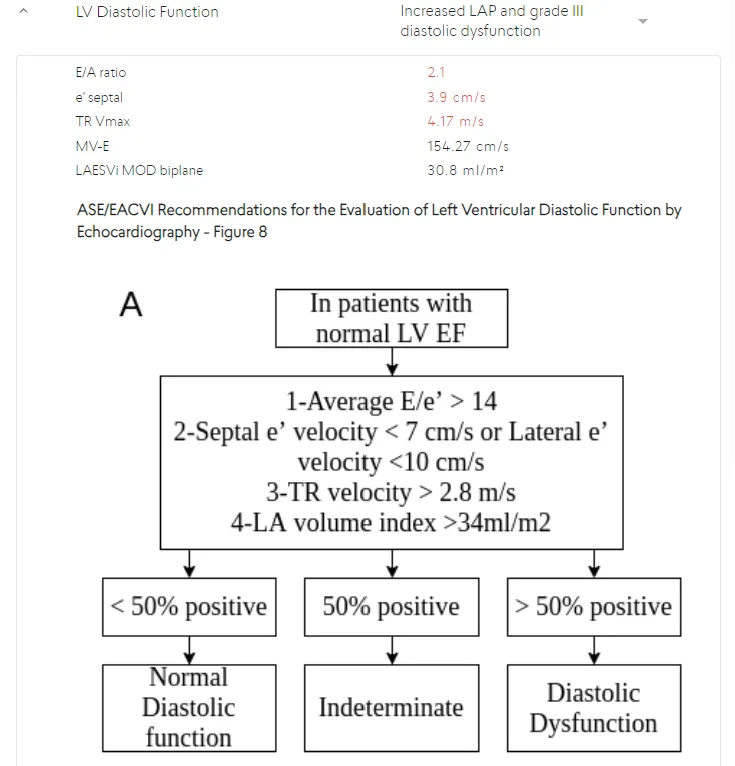
When approved International Reference Guidelines are available for a measurement, they can be viewed, along with the exact reference where the Guideline determination can be found, in an expanded panel by clicking on the arrow next to the measurement name.
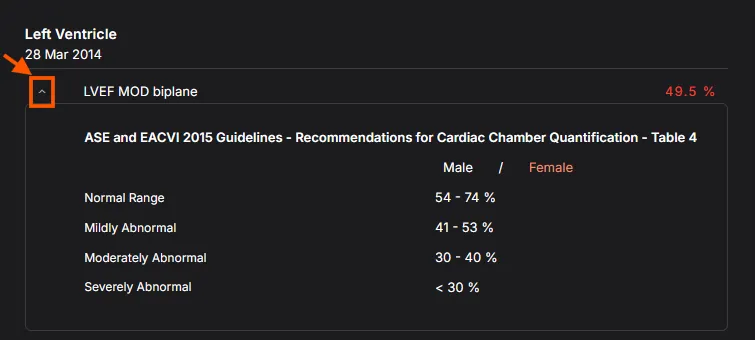
If measurement values are available in the Report, then the parameters in approved International Reference Guidelines will be used to generate Main Findings or Clinical Notes for the study. If any measurement values required by the International Reference Guidelines are missing, then the related Main Finding will not be displayed.
4.4.2 International Reference Guidelines
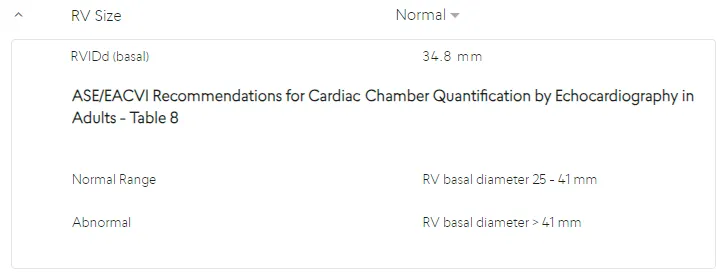
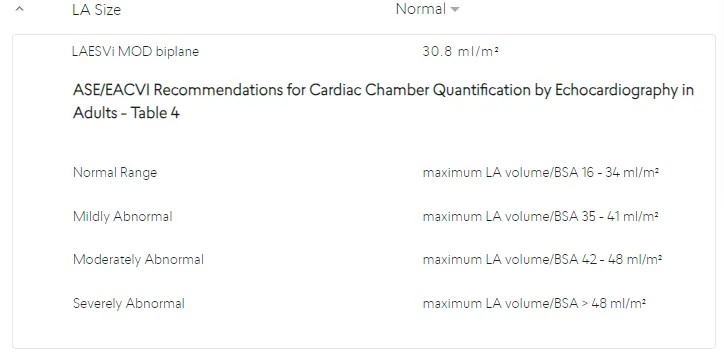
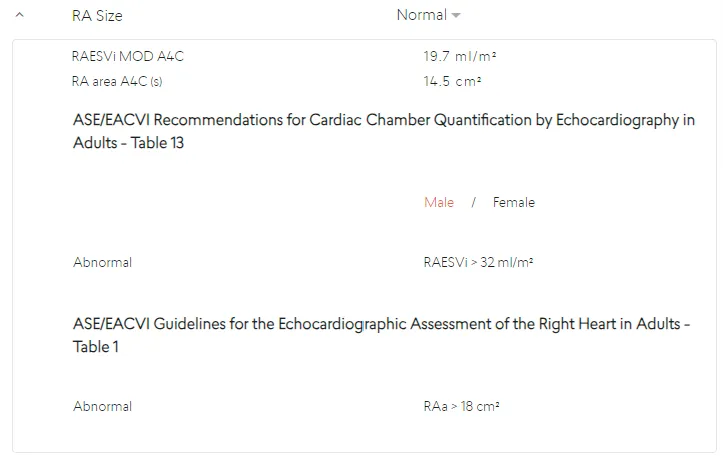
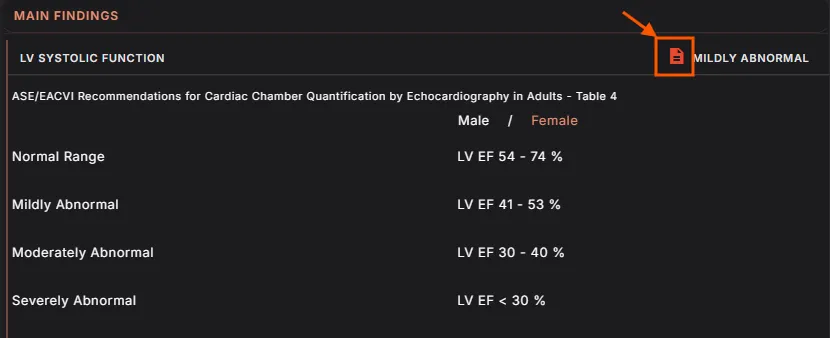
The list of possible Main Findings that can be displayed using International Reference Guidelines are:
LV Systolic Function
LV Diastolic Function
LV Size
LV Geometry
RV Function
RV Size
LA Size
RA Size
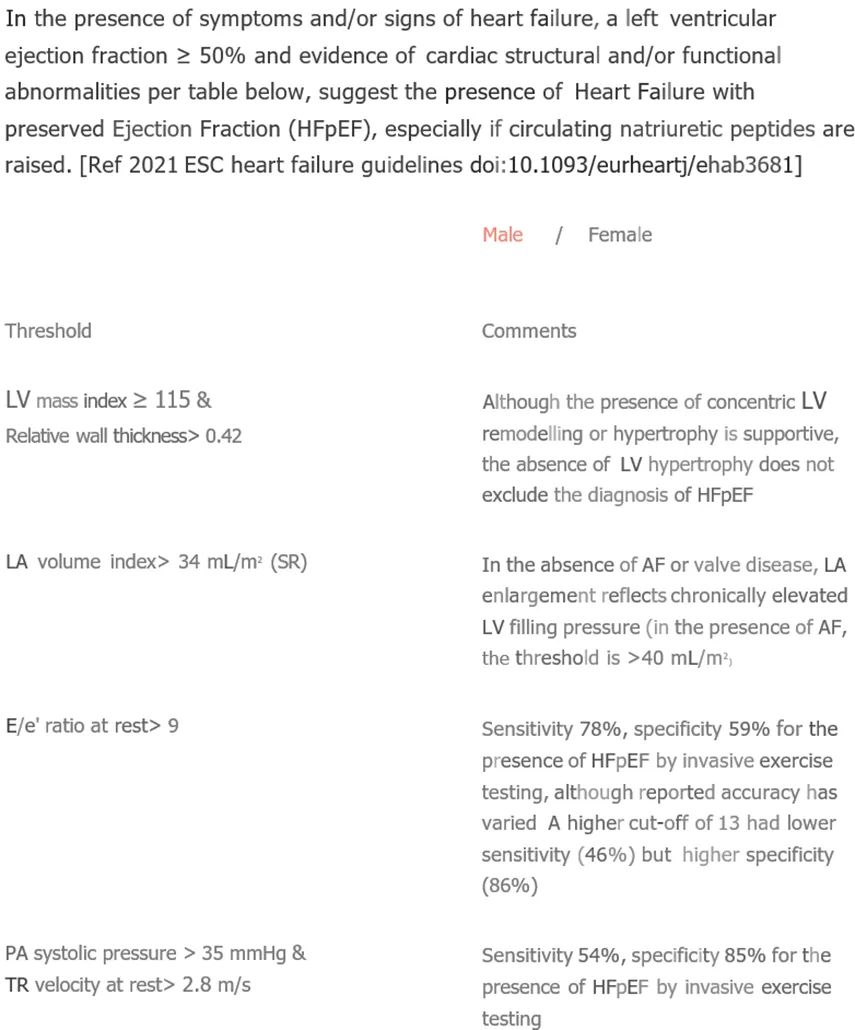
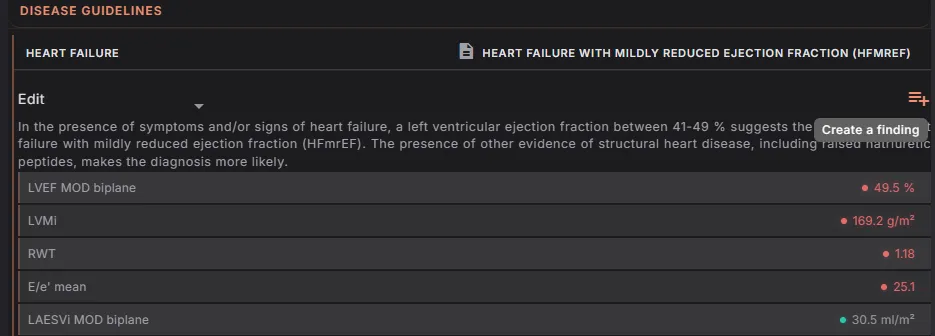
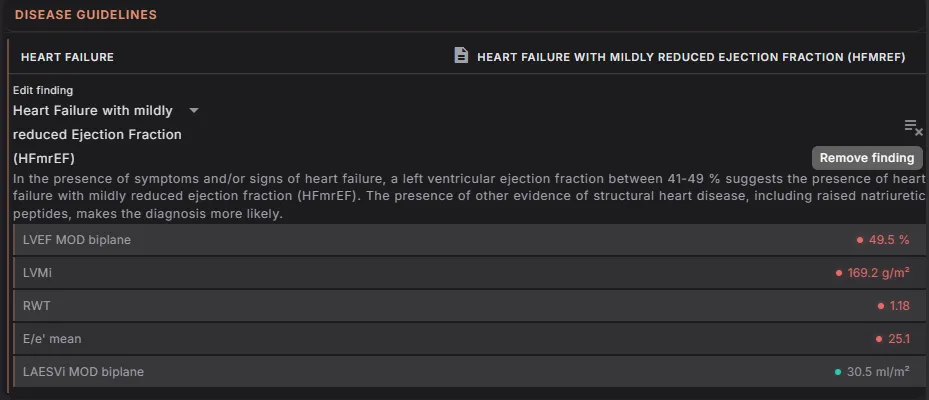
Heart Failure with Preserved Ejection Fraction (HFpEF)
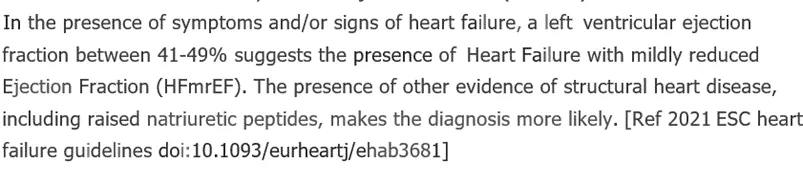
Heart Failure with mildly reduced Ejection Fraction (HFmrEF)
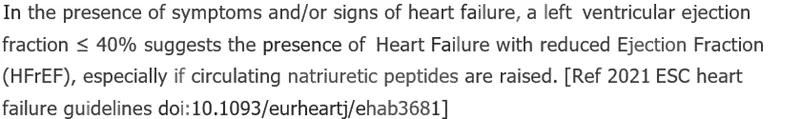
Heart Failure with reduced Ejection Fraction (HFrEF)
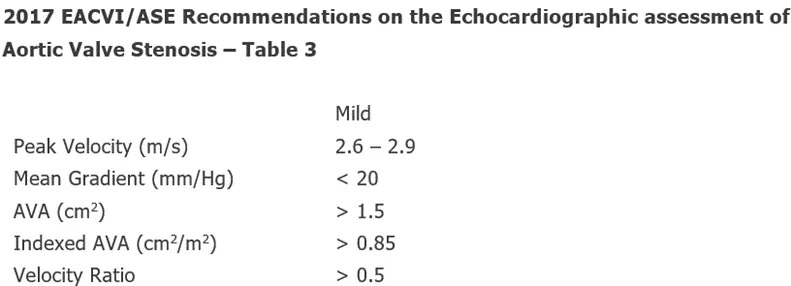
Mild Aortic Stenosis
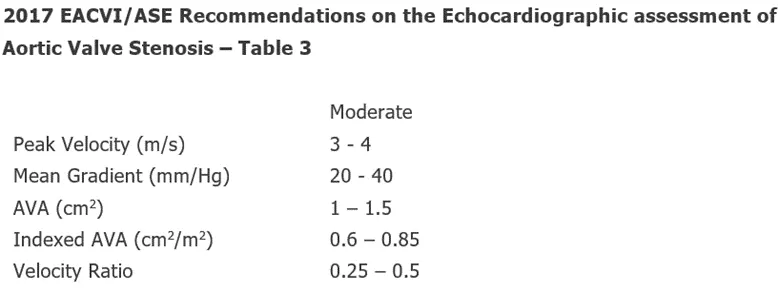
Moderate Aortic Stenosis
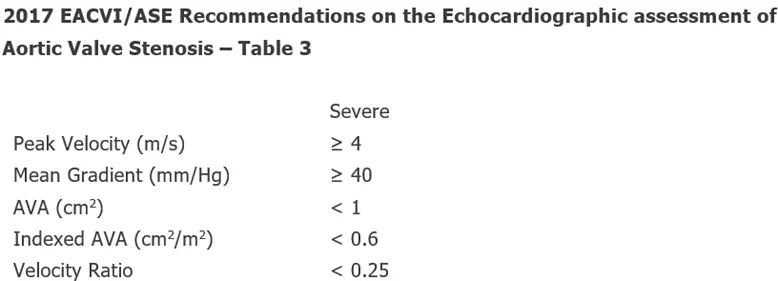
Severe Aortic Stenosis
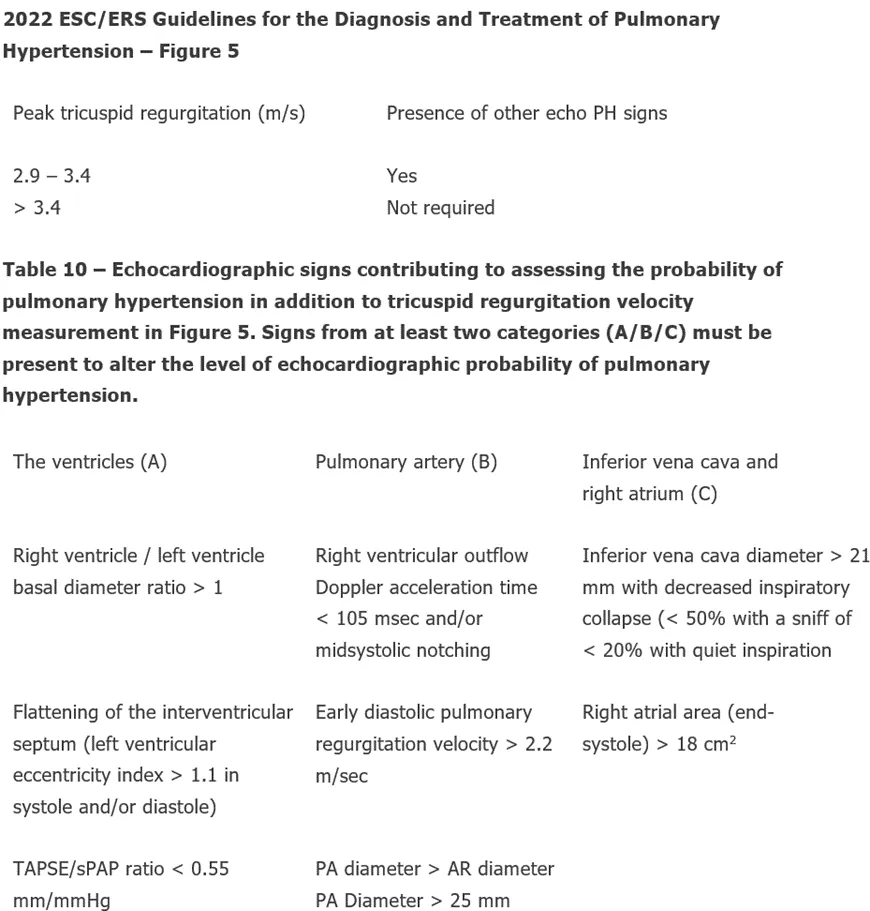
Low Echocardiographic Probability of Pulmonary Hypertension
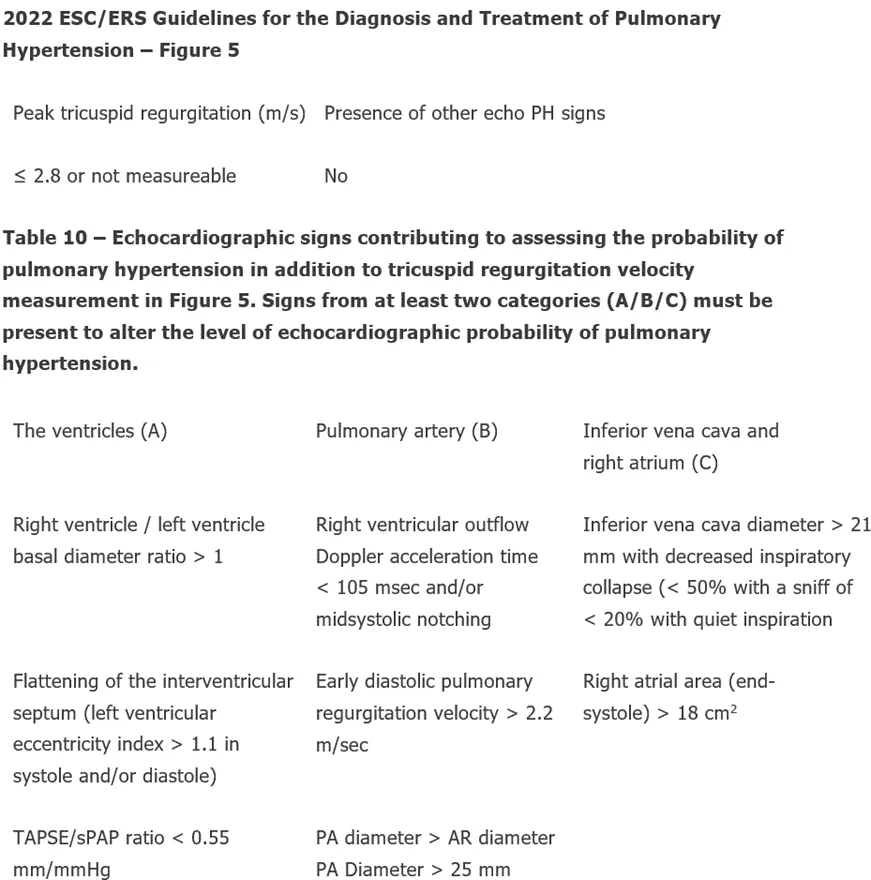
Intermediate Echocardiographic Probability of Pulmonary Hypertension
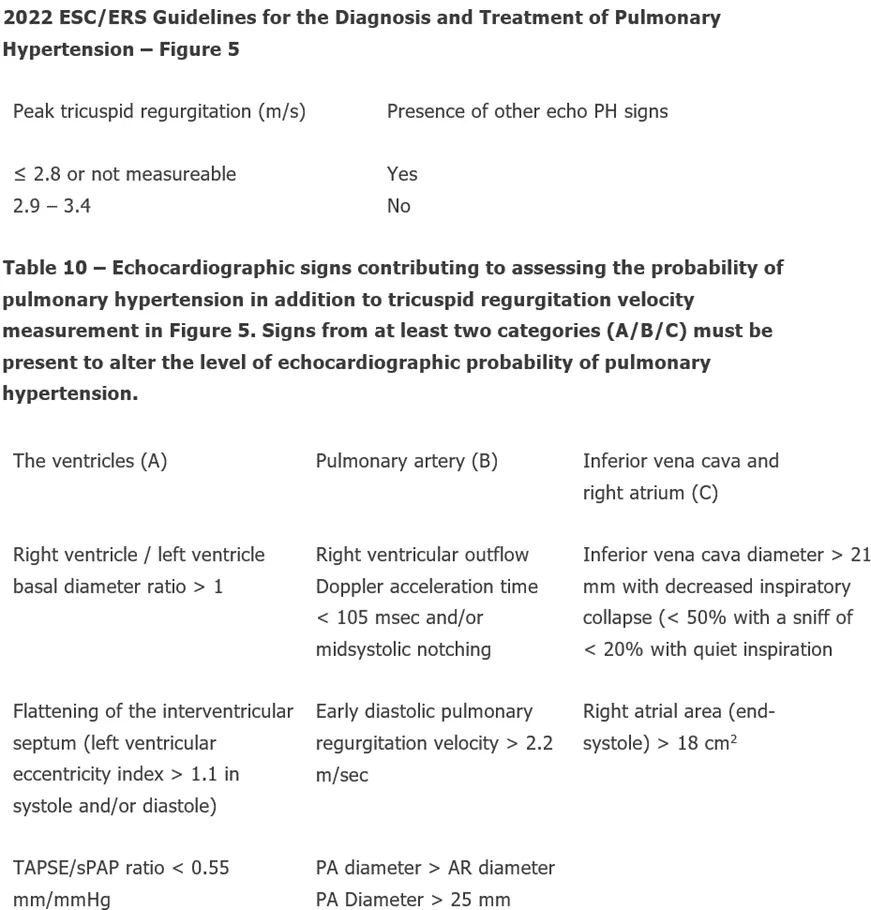
High Echocardiographic Probability of Pulmonary Hypertension
Cardiac Amyloidosis
Hovering over a measurement name displays a preview of the annotation made and underlying measurement. Measurement values that fall outside of available International Reference Guidelines are highlighted in red. You may edit the measurements/suggested conclusions, illustrated in Section 4.3.
If a measurement value is calculated from more than one annotation, they can all quickly be reviewed by clicking the pull down arrow in the preview image.
4.4.3 Editor page - Panoramic View User Interface
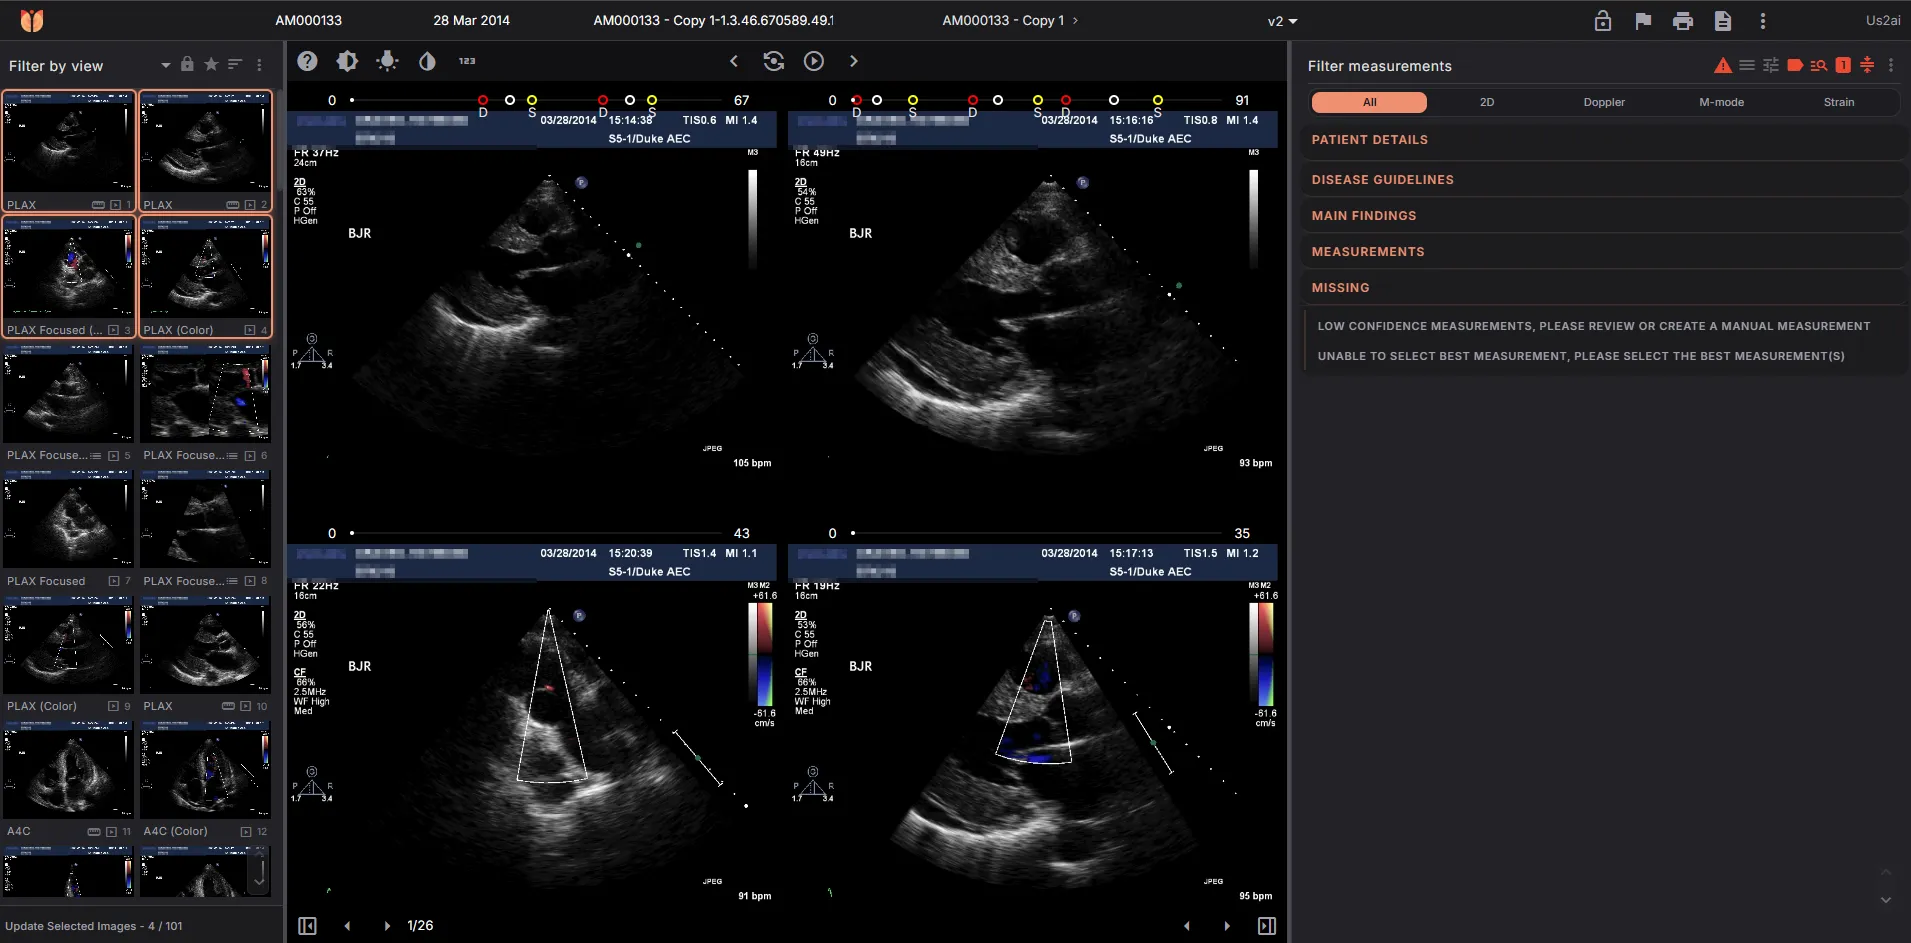
The default panoramic user interface is composed of four main panels:
- Settings Panel – Provide access to configuration options.
- Image Overview Panel – Displays all acquired images.
- Image Display Panel – Displays the selected DICOM images.
- Report Display Panel – Shows the patient's report.
This user interface can be further expanded to support multiple screen configurations for enhanced flexibility.
Settings Panel
The settings panel is the default for all users. Additional features will be available based on the user's permission level. For a detailed list of available functions, please refer to section 5.6.11.
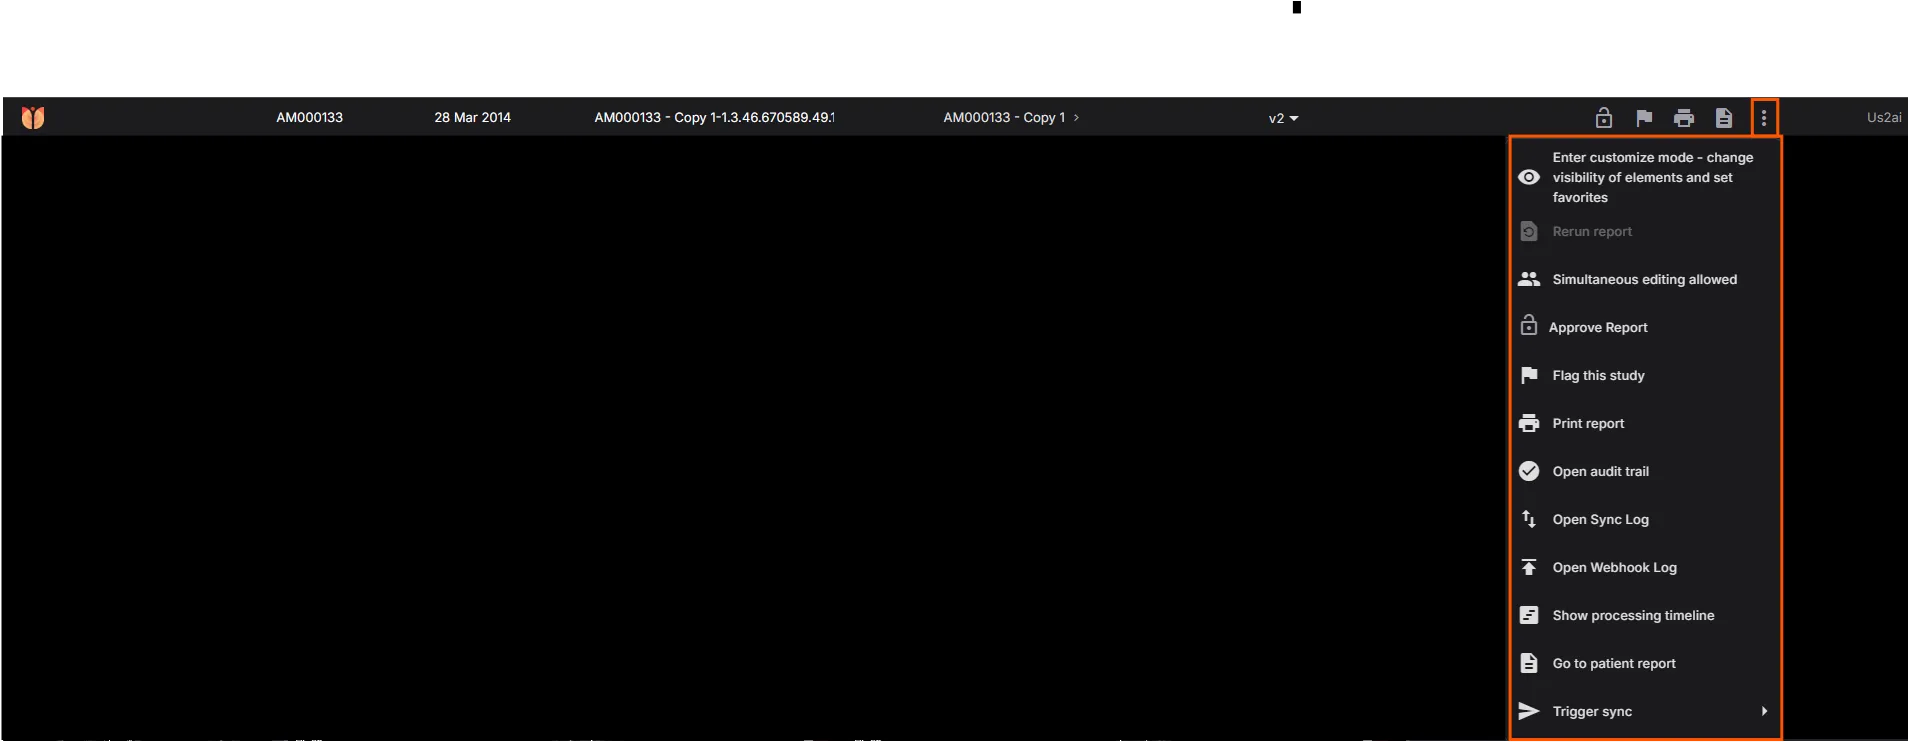
Image Overview Panel
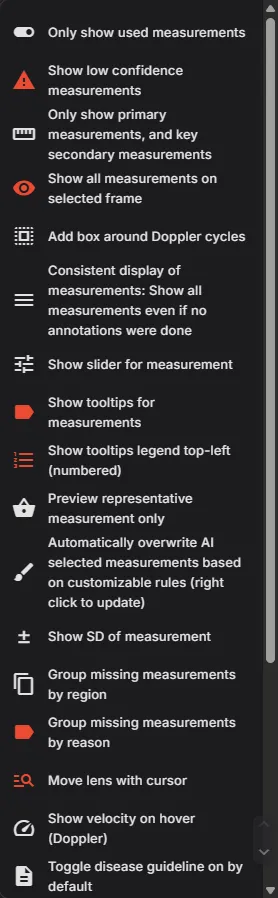
The image overview panel allows customization of displays, advanced sorting and filtering, and view management, including relabeling, reprocessing, deleting views, and creating new exams from DICOM subsets. Filter by view allow search for specific view.
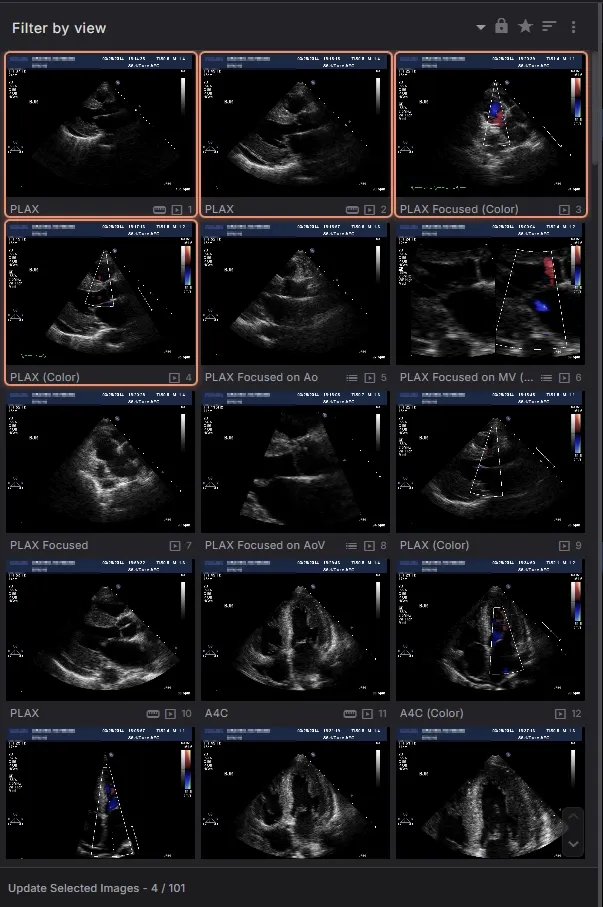
For a detailed list of available functions, please refer to section 5.6.11. Upon selecting "Update Selected Images," the following view will be displayed.
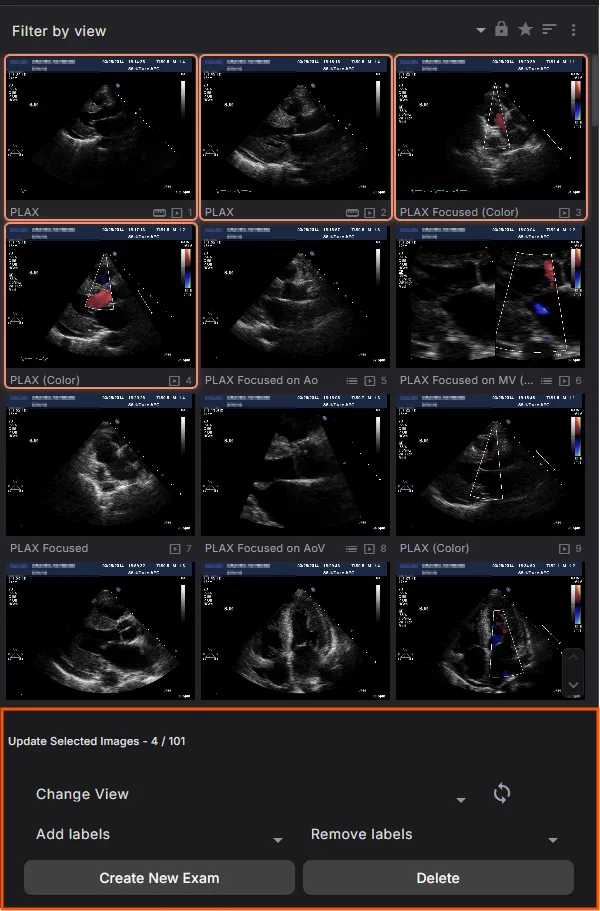
This view allows users to:
- Change View Labels: Select a view and choose a new label from a dropdown menu.
- Remove Labels: Delete unnecessary labels for a cleaner dataset.
- Reprocess Views: Update individual views.
- Create New Exams: Generate a new exam from selected subset of DICOMs.
- Delete Views: Remove specific views from the DICOM dataset.
The panel is fully flexible, by placing the cursor in between the panel (1), allow users to drag left and right to adjust the number of images displayed in a column. Users can also lock the number of images shown (2), ensuring consistency even when resizing the panel.
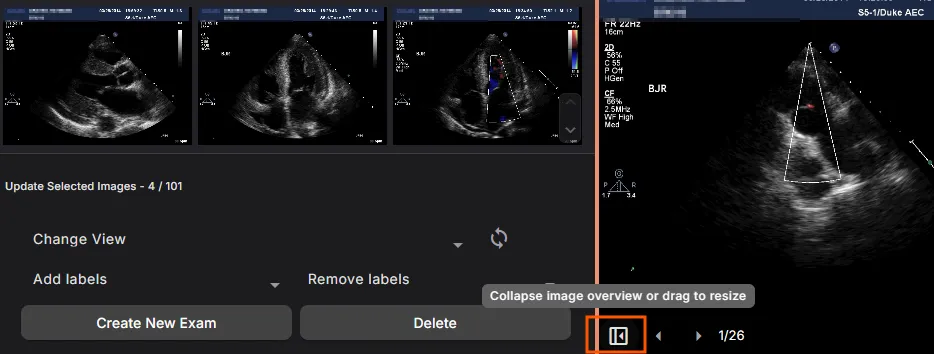
Image Display Panel
Images can be selected from the thumbnails, and the corresponding image will be displayed in the image display panel. You can choose to display images in 2x2, 4x4, or any preferred layout. If you uncheck a box next to a thumbnail, that image will no longer be shown in the image display panel.
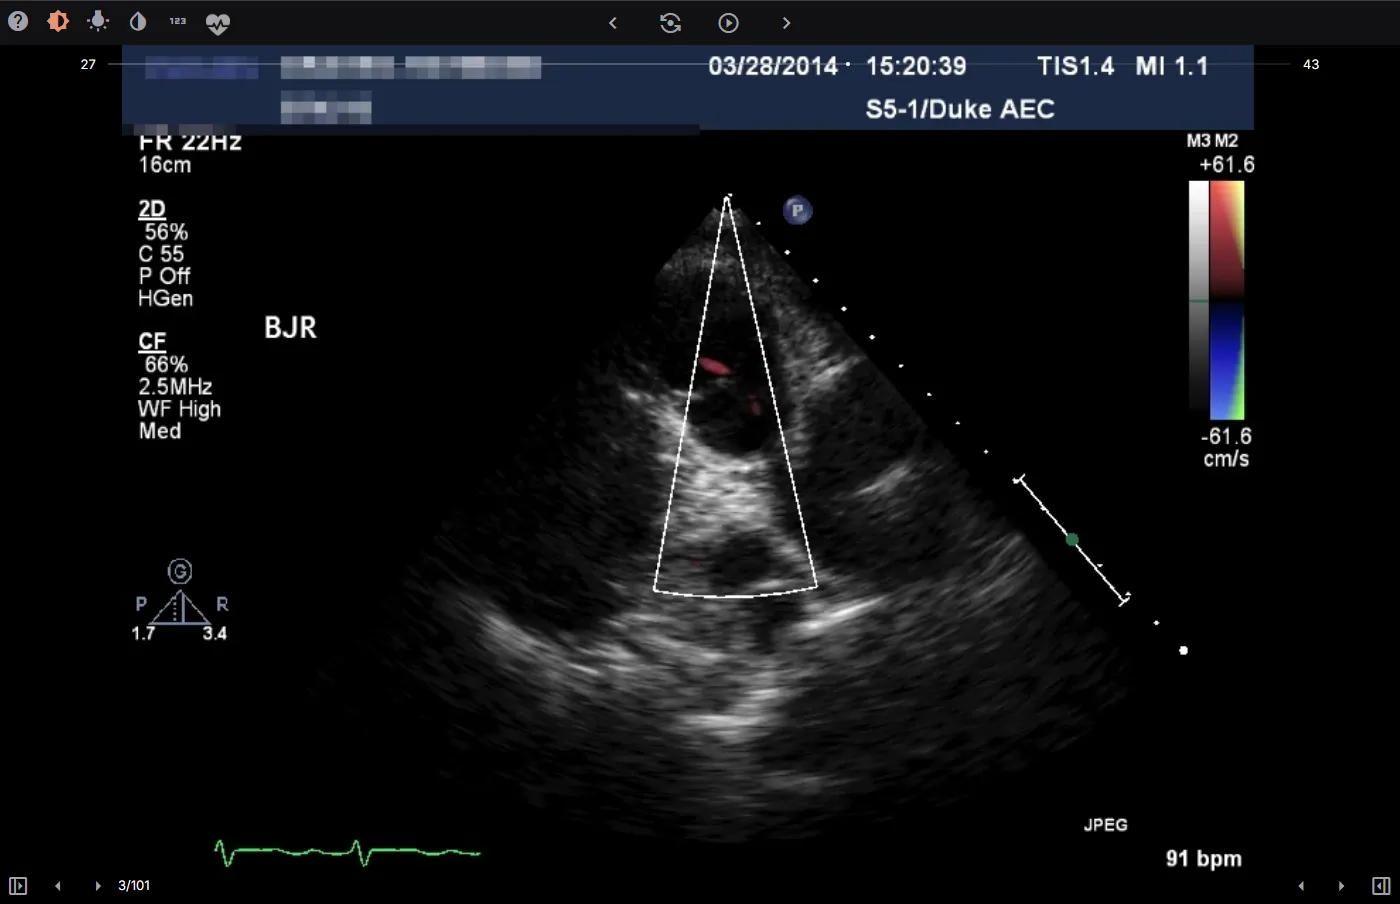
The Image Display Panel includes several features to enhance and control the displayed media:
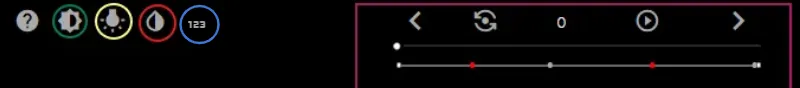
Playback Control
- Play/Pause: This component allows you to play and pause the video.
- Yo-Yo Loop: Continuously cycle the video between specified start and end frames.
- Playback Speed: Adjust the video’s playback speed to your desired pace.
- Frame Navigation: Use the next and previous frame to select specific frames.
- Red dot indicate diastole frames.
- Grey dot indicate systole frames.
Image Adjustment:
- Contrast: Use the slider to adjust the contrast of the displayed image.
- Brightness: Use the slider to modify the image brightness.
Image Filter:
- Sepia Filter: Apply a classic sepia filter to the displayed image.
Display Sequence Number:
- Sequence Number: Toggle this option to show or hide the sequence number overlay on the image.
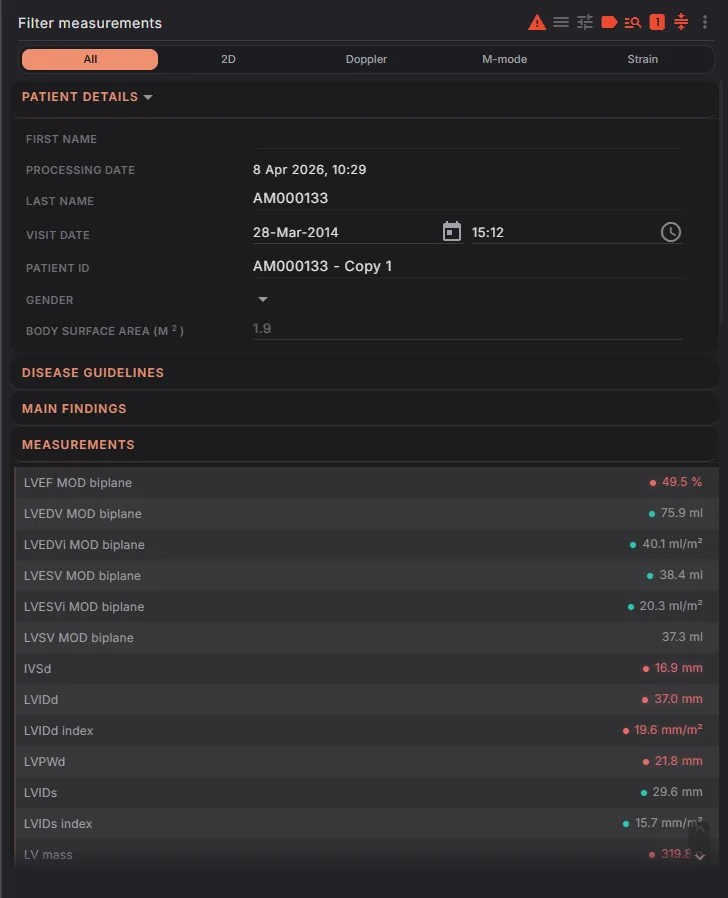
Report Display Panel
This panel includes detailed patient information, measurements by views, and measurements by regions. It also highlights any missing measurements, which are displayed by default to ensure users can easily identify and address incomplete data.
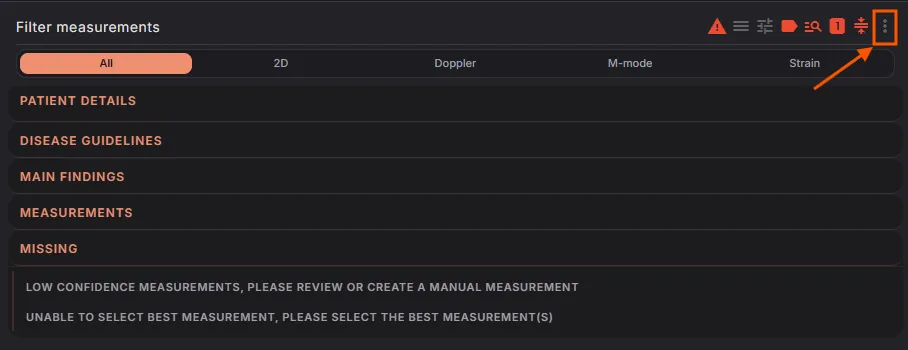
- Filter Measurements Bar
- Use the search bar at the top to filter or search for specific measurements or findings.
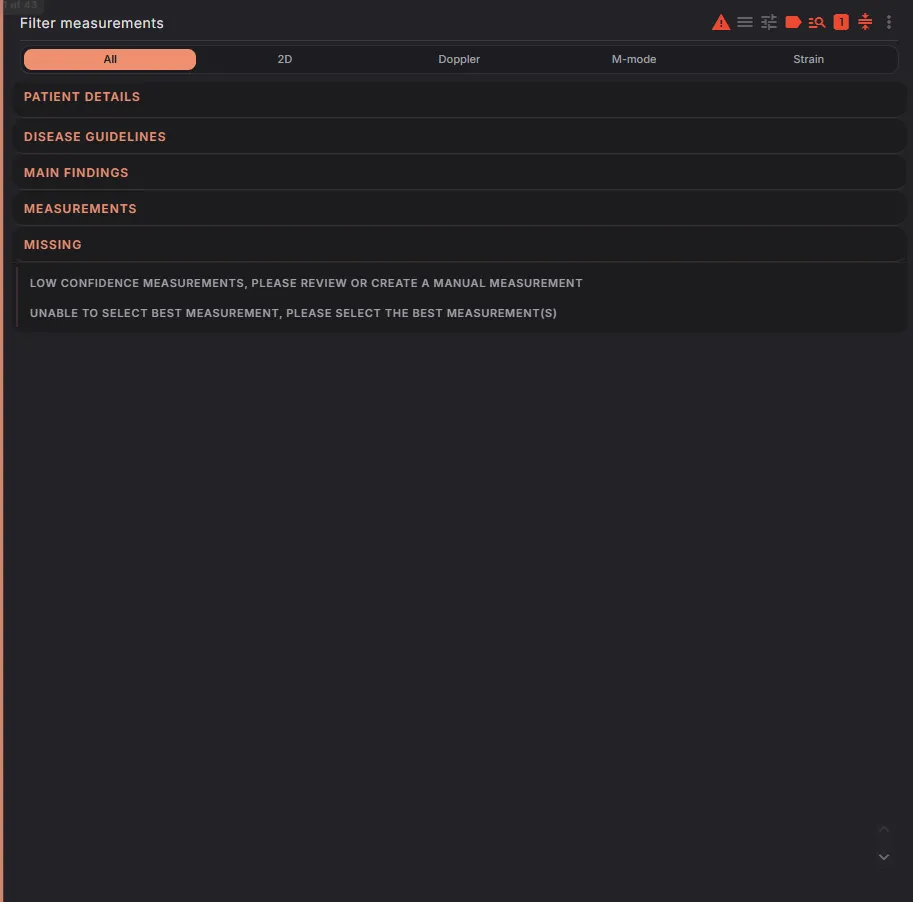
- Use the search bar at the top to filter or search for specific measurements or findings.
- Navigation Icons
The following features enhance the report's functionality:
- Toggle: When enabled, measurements with (high confidence) are displayed.

When disabled, measurements with (moderate confidence) are shown for review, allowing users to verify and add them to the report as needed.

- Low Confidence Measurements: Measurements with an exclamation mark indicate low confidence and are also displayed for review, allowing users to verify and add them to the report as needed.

- Unflagging Measurements: To unflag all flagged measurements at once, hover over a flagged value. An icon will appear, allowing you to unflag them with a single click.

- Toggle: When enabled, measurements with (high confidence) are displayed.
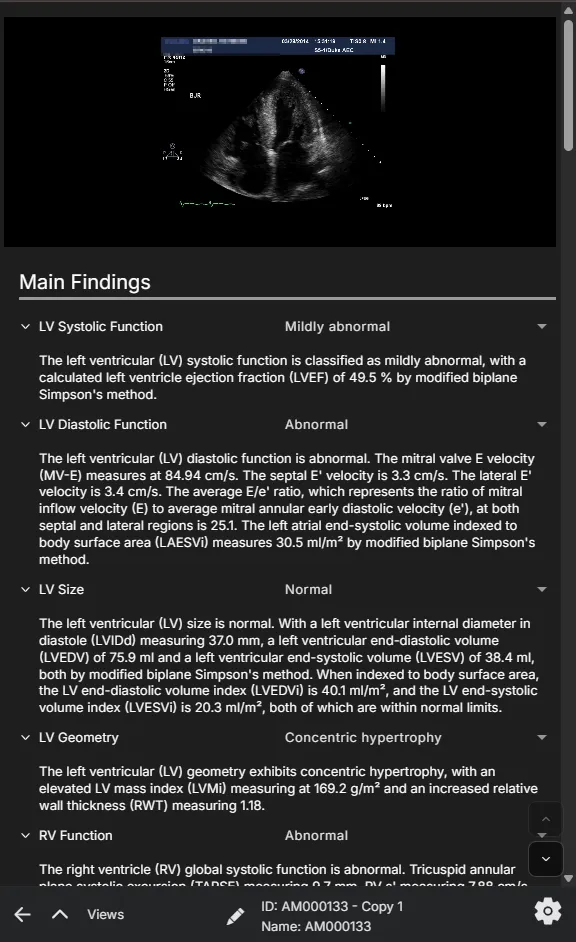
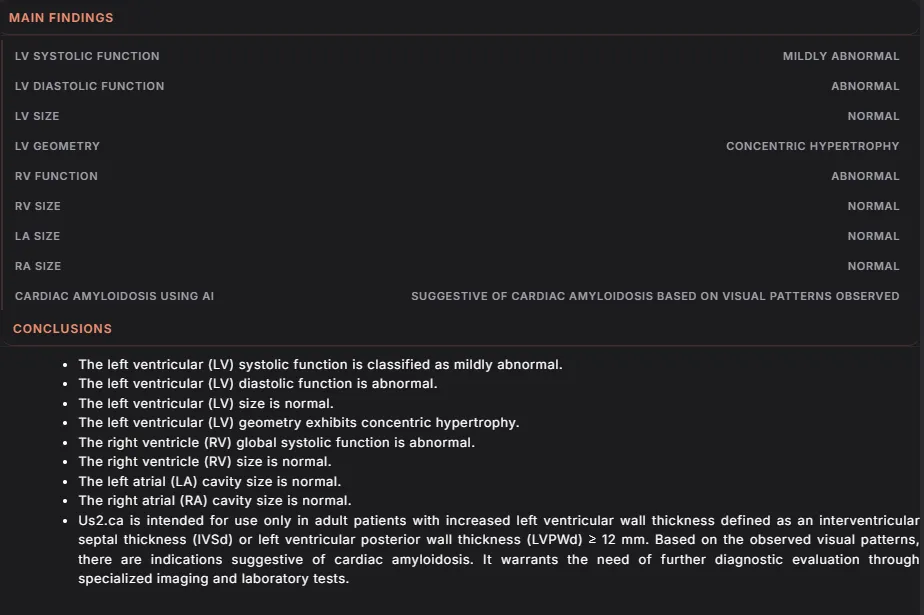
- Main Findings Section
The main findings section provides an auto-generated summary of key measurements and results. The content displayed is tailored based on the protocol selection configured within your user account. This section includes functional and structural assessments of the heart.
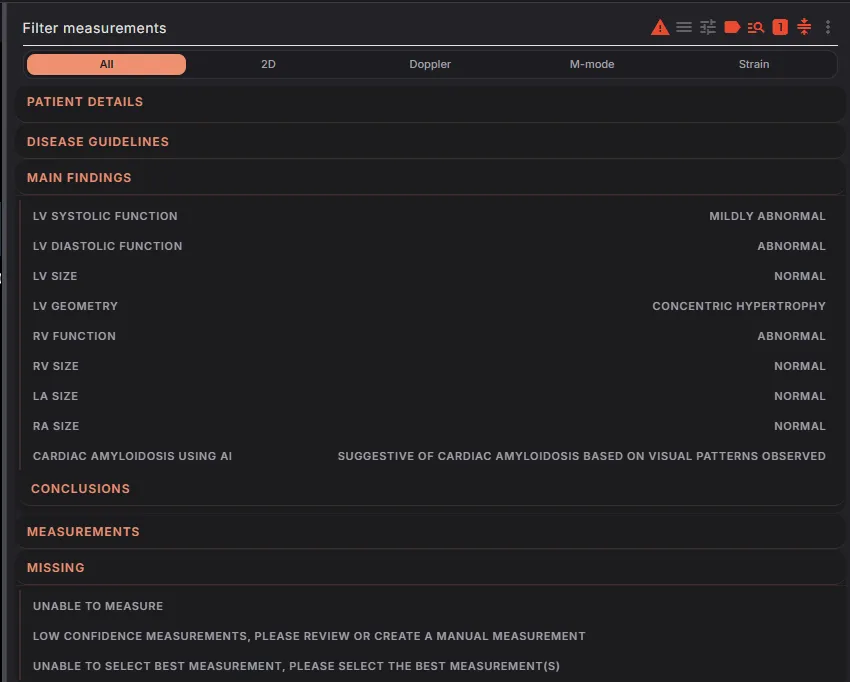
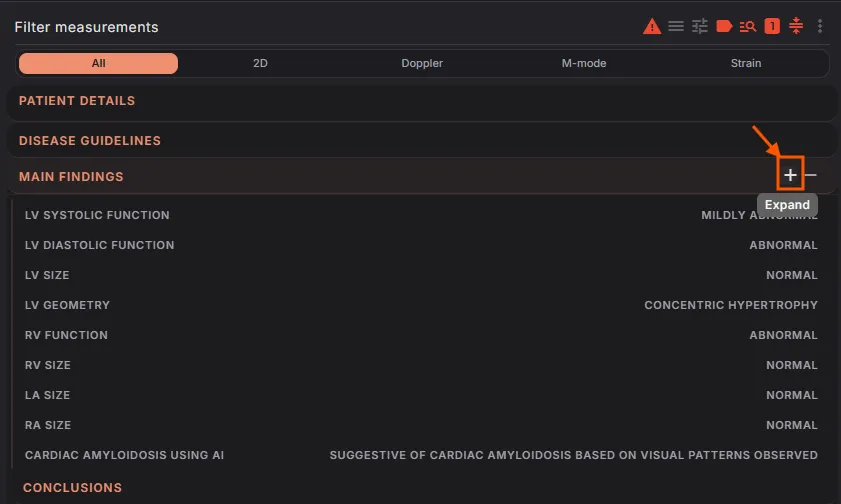
Click + to expand and view detailed measurements and guidelines. Click - to collapse the section.
Edit Findings
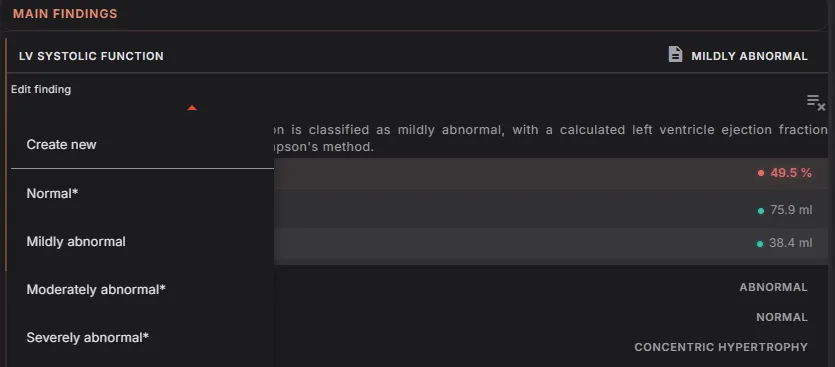
- To modify a finding:
- Click on the dropdown menu under the selected parameter (e.g., LV Systolic Function).
- Choose from available classifications such as Normal, Mildly Abnormal, Moderately Abnormal, or Severely Abnormal.
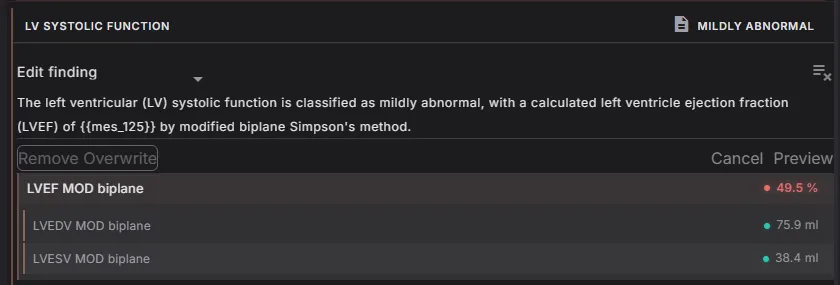
Paragraph Editing
- For detailed edits, press Ctrl + Left Click on the desired paragraph to enable direct editing.
Disease Guideline Integration
- Toggle on the guideline icon to display the ASE/EACVI Guidelines. These guidelines provide reference ranges and classification criteria for measurements, ensuring clinical accuracy.
- To modify a finding:
- Additional Sections
- Conclusions: Summarizes findings for quick interpretation. The conclusion section within the report can be enabled or disabled according to your preference.
- To toggle this setting:
- Navigate to the Settings page.
- Go to Report settings.
- Toggle "Show short conclusion in report" on or off to control whether the conclusion appears in the final report.
- Disease Guidelines: All findings within the Disease Guideline can be added to the “Main Findings” section
- Select "Create a finding" to move it up to the Main Findings section.
- To remove a finding from the report, select "Remove finding".
- Select "Create a finding" to move it up to the Main Findings section.
- Measurements by Region/Views: Break down measurements based on region or imaging view. For detailed instructions on how to edit, add or delete measurements for 2D, Doppler and GLS, please refer to sections 5.6.5 to 5.6.8 in the user guide. These sections will guide you through the steps for modifying measurements within those categories.
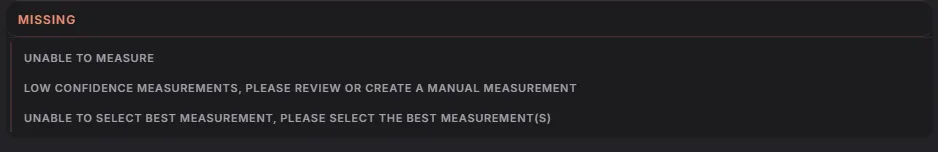
- Missing: Flags missing measurements for attention.
4.4.4 Supplemental Modules
For users with access to supplemental modules that uses AI to identify patients who need additional follow up for the various disease(s) but do not replace current standards of care.
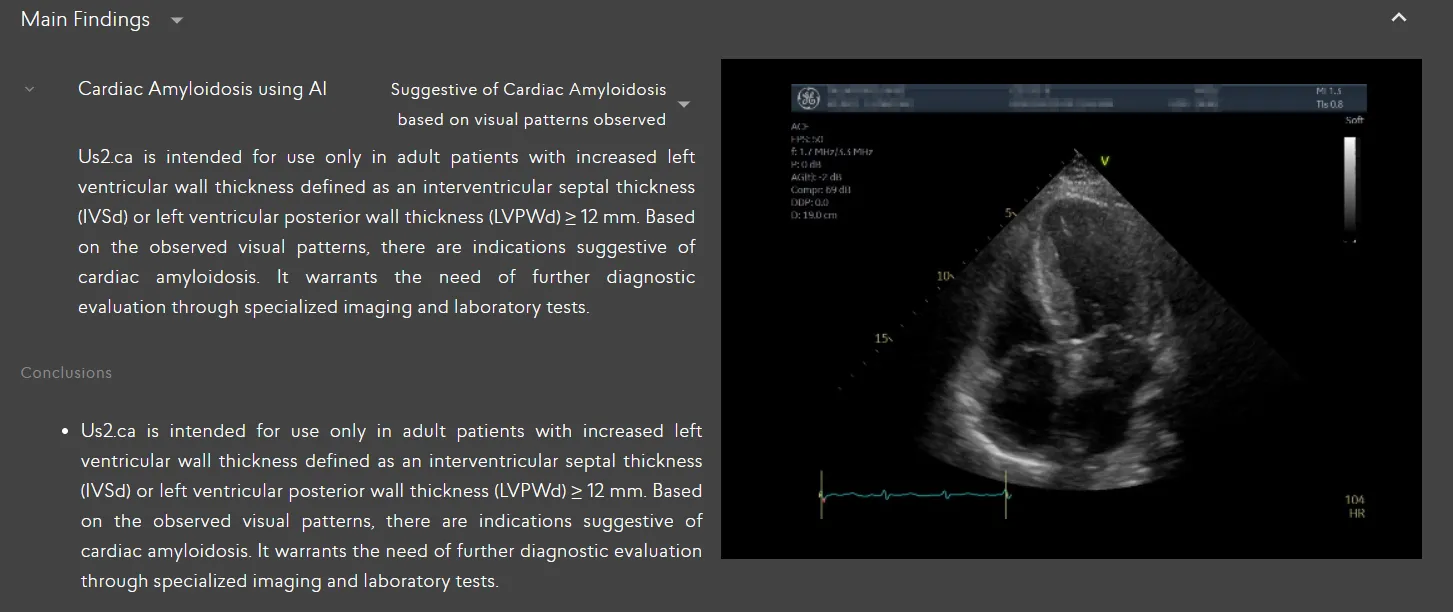
4.4.4.1 Cardiac Amyloidosis - AI
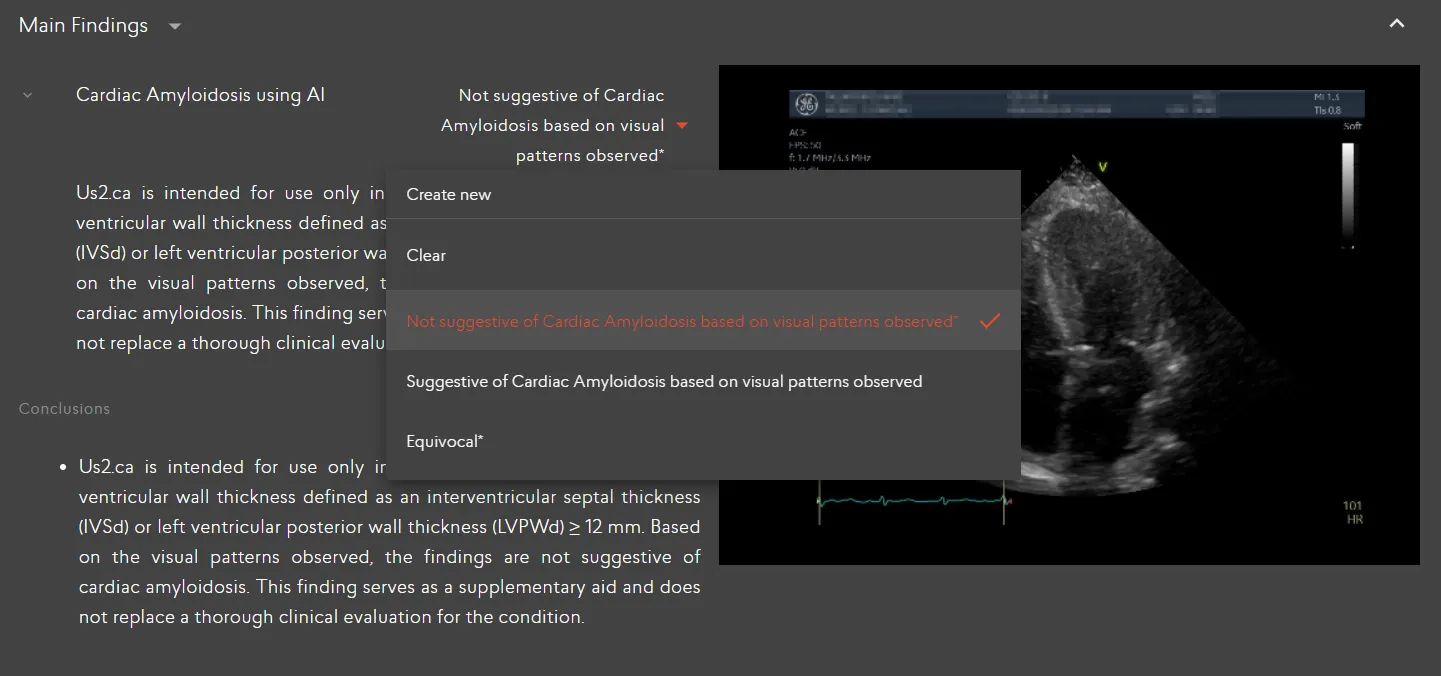
When echocardiogram studies are sent to the Us2.ai software, it will process the A4C views before the report is generated. Within the generated report, Us2.ca will mention whether a patient study is “Suggestive of Cardiac Amyloidosis” when the model detects the disease with a sufficiently high level of confidence. This result is presented to the user under the Main Findings section illustrated below,
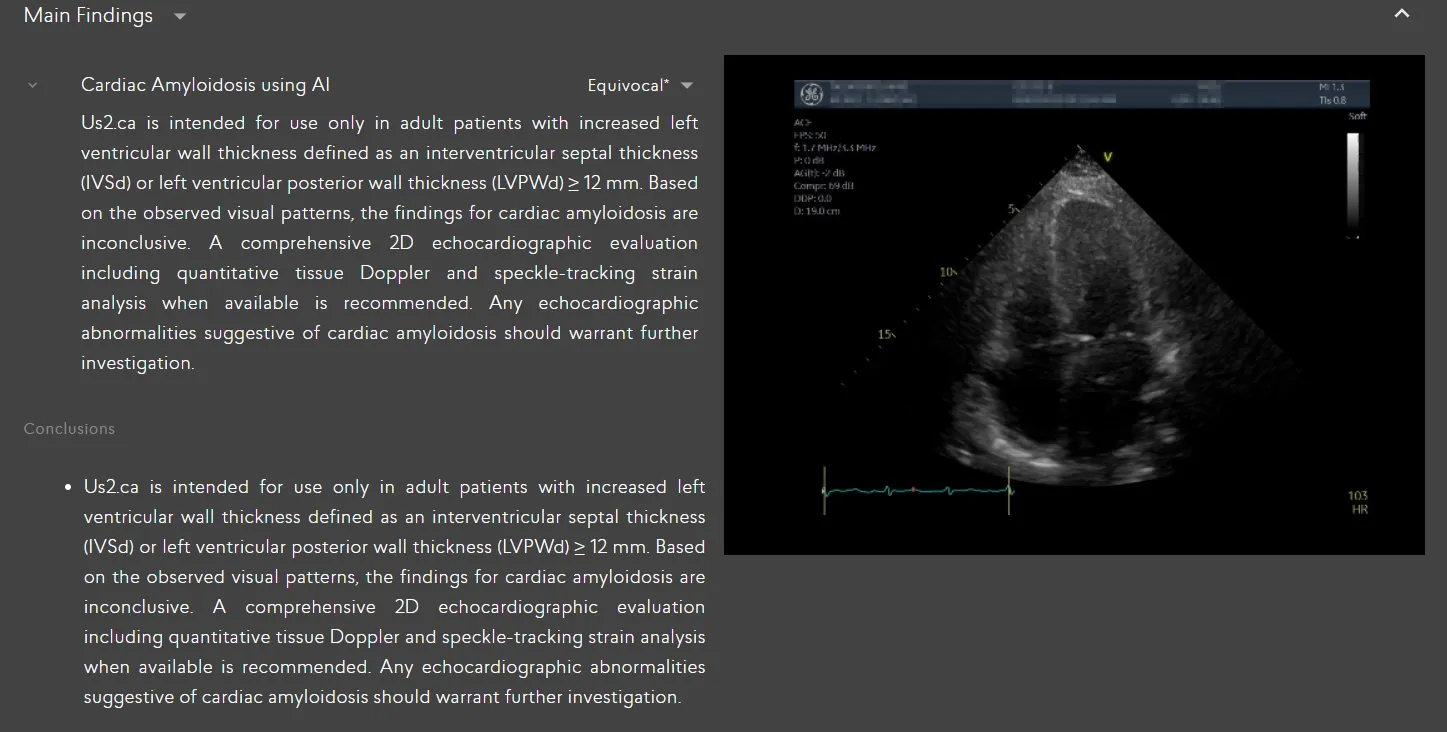
When the model is uncertain, the generated report will mention “Equivocal” for Cardiac Amyloidosis
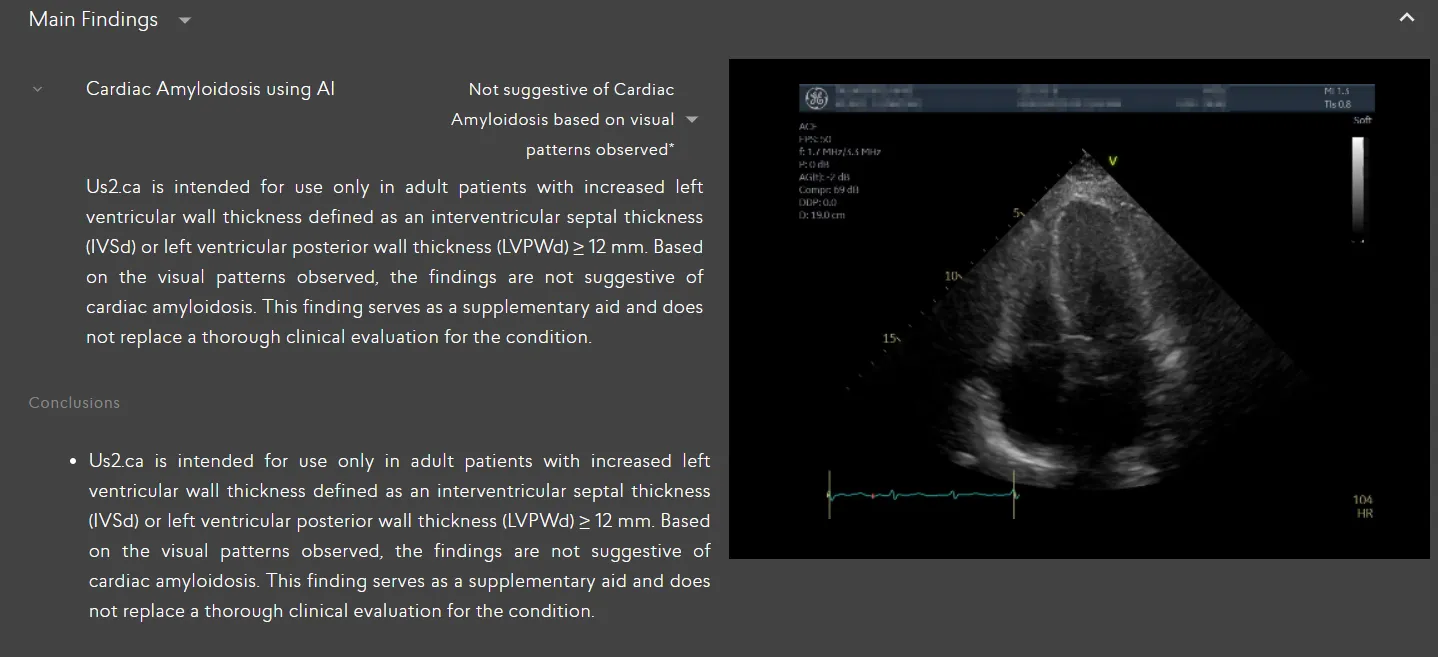
When the model does not observe any visual patterns to suggest Cardiac Amyloidosis, the generated report will mention “Not Suggestive of Cardiac Amyloidosis based on visual patterns observed” along with the emphasis that it does not mean the total replacement of a thorough clinical evaluation.
Us2.ca serves as a decision support tool to guide users in their clinical decision-making as they review and finalize the patient study for CA. Clinicians will see a potential CA finding flagged when opening a report, which they can clear the findings or change the decision then approve or reject.
Check with your dedicated Us2.ai representative if this module is already available in your region.
5 Advanced Functions
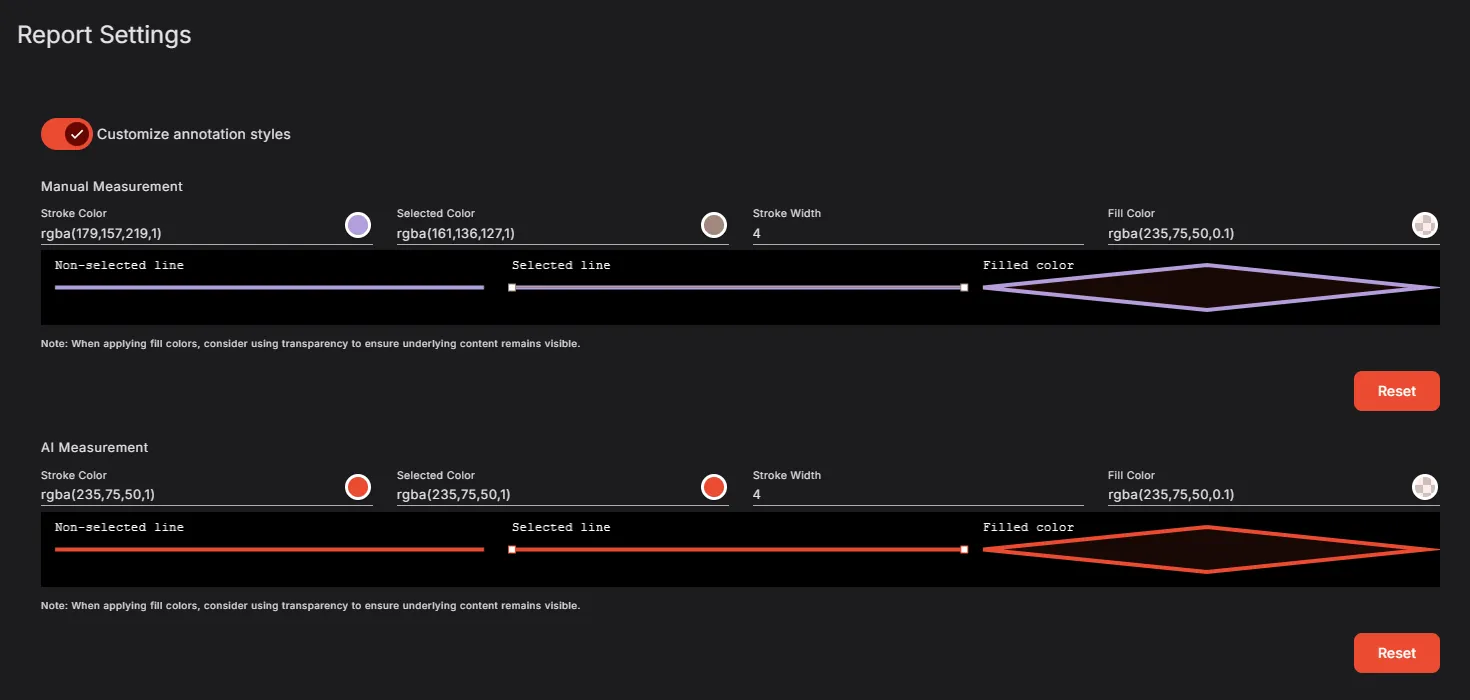
5.1.5 Customize Annotation Styles
There is a flexibility to adjust both the color and opacity of annotations directly from the settings page. This allows you to tailor your annotations to better fit your visual preferences and improve readability.
5.1.6 Report Customization
5.1.6.1 Signature
5.1.6.1.1 Creating and Managing Signature Templates and Authentication
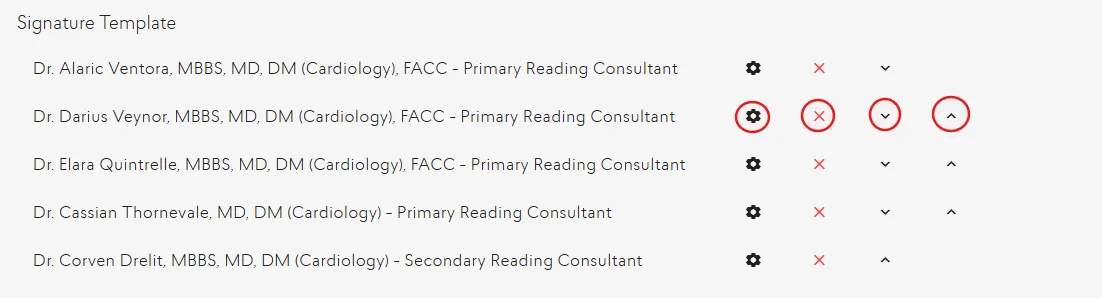
You can now apply digital signatures with customizable templates, PIN-based authentication, and protocol-specific defaults. In addition, you can now add multiple reading consultants to a report using a convenient dropdown selection.
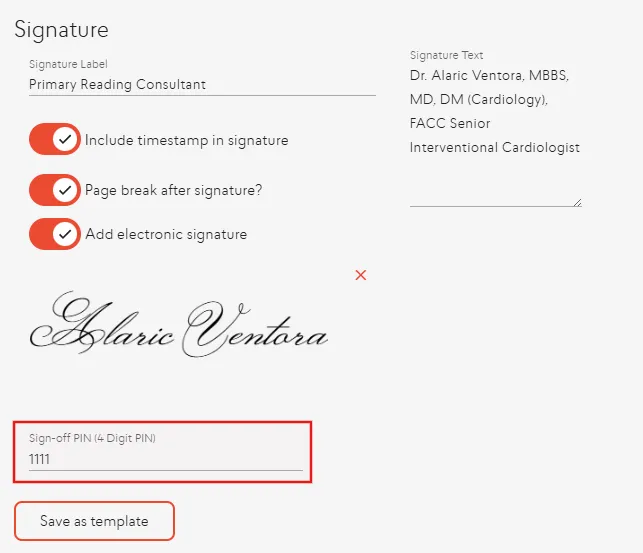
- Access the Signature Section: Navigate to the Signature section in the application.
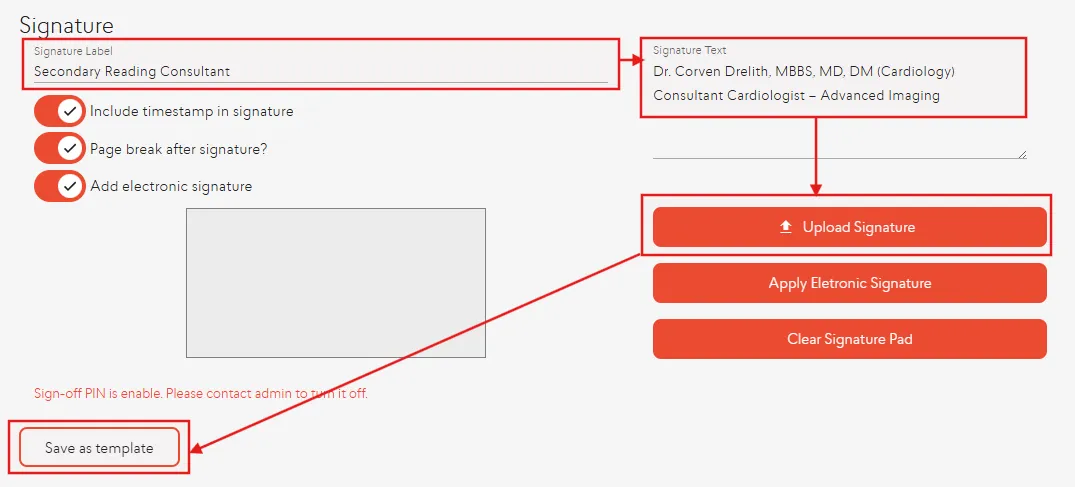
- Enter Signature Details:
- In the Signature Label, indicate the role (e.g., Reading Consultant, Sonographer).
- In the Signature Text, enter the doctor’s name, position, and credentials.
- Upload Signature Image: Click Upload Signature to upload the doctor’s signature file.
- Save as Template:
- Click Save as Template.
- A pop-up will appear asking for a Signature Template ID.
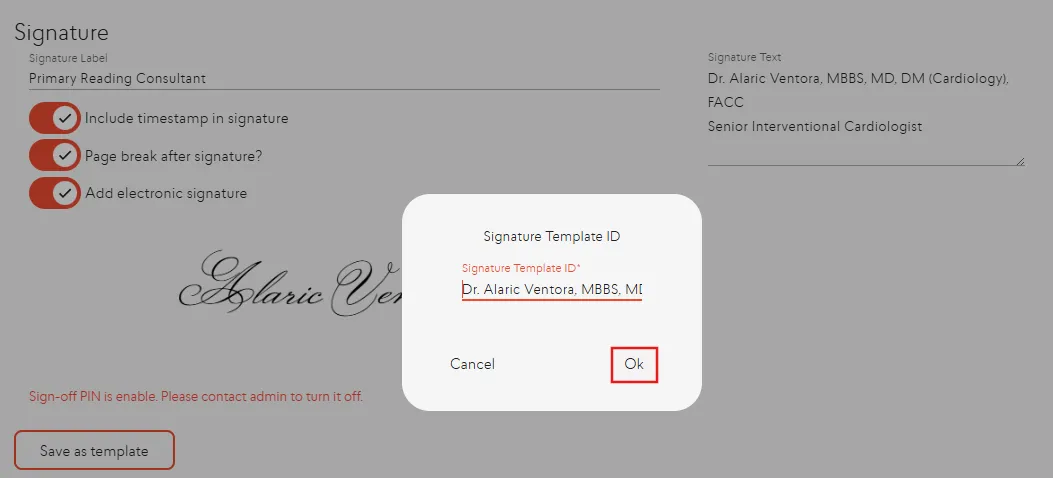
- Select OK to confirm.
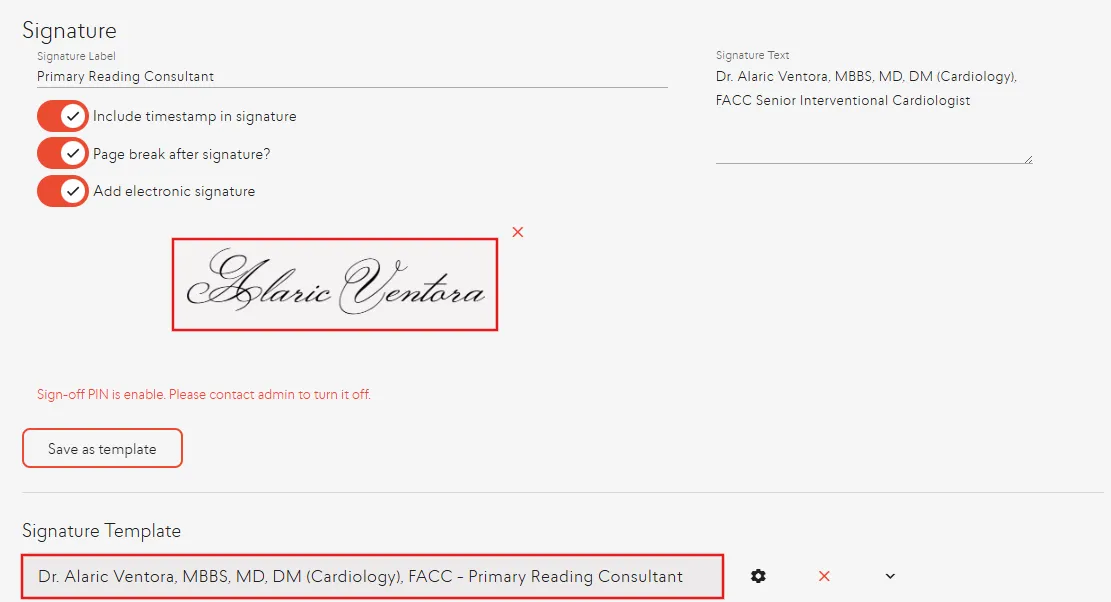
- Example Preview: Once saved, the signature will appear in the report as shown in the preview.
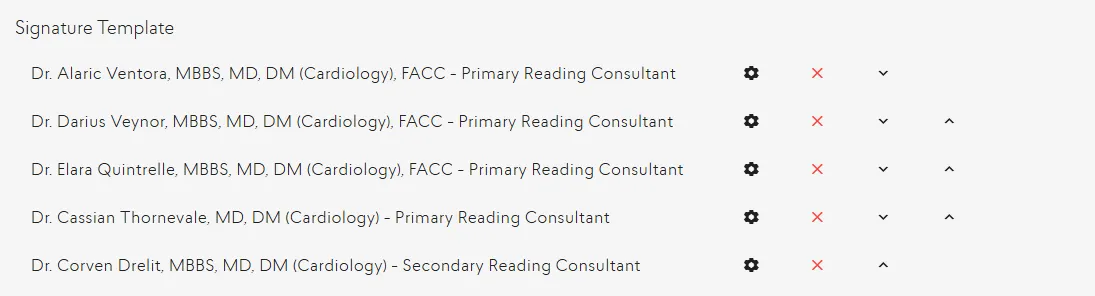
- Adding Multiple Doctors:
- Repeat the above steps to create templates for multiple doctors.
- These templates can then be selected from the dropdown list when signing off a report.
- Repeat the above steps to create templates for multiple doctors.
- Associating Signatures with Protocols:
- You can tie a signature to a specific protocol.
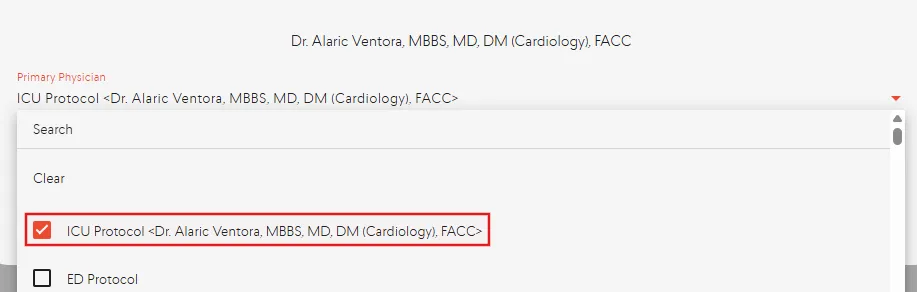
- When that protocol is activated, the system will automatically load the corresponding doctor’s signature for the report.
- You can tie a signature to a specific protocol.
- Additional Signature Controls:
- Set Default Signature Based on Protocol: Automatically apply a pre-defined signature for a given protocol.
- Remove Signature Template: Delete an existing template if no longer needed.
- Move Up / Move Down: Adjust the order of signature templates in the dropdown list.
5.1.6.1.2 Activating PIN Authentication (Optional)
You can enable PIN-based authentication to securely apply digital signatures.
- Access Admin Settings:
- Click on your username and select Admin.
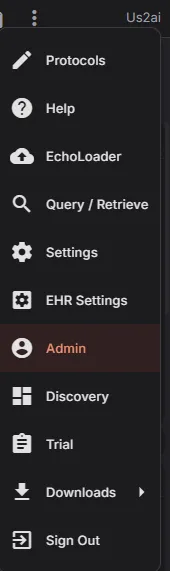
- Click on your username and select Admin.
- Configure User PIN:
- Click on the username and go to Print Settings.
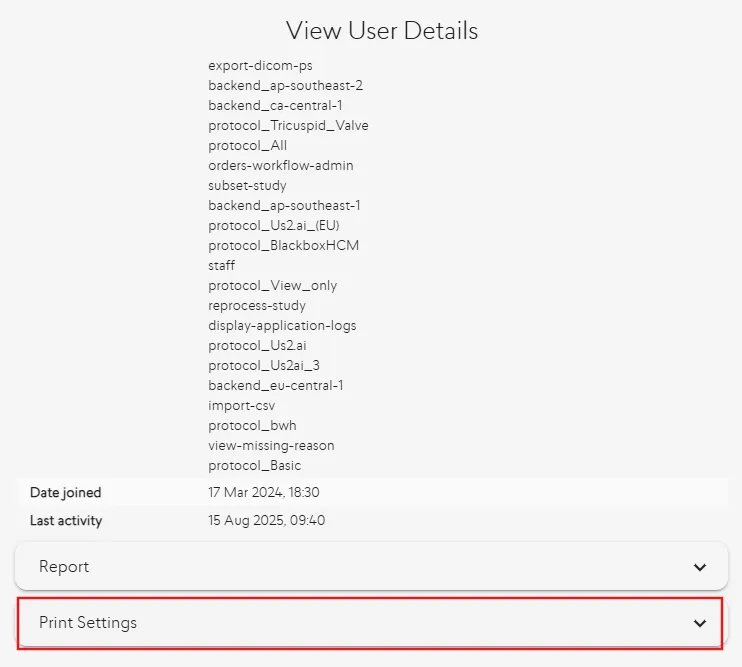
- Locate the Sign-off PIN field (4-digit PIN) and enter the desired PIN.
- Click on the username and go to Print Settings.
- Save Settings:
- Ensure you save your changes to enable PIN authentication for signing reports.
5.1.6.1.3 Applying Digital Signatures to a Report
Once all signature templates and PIN authentication are set up, you can apply signatures when preparing a report:
- Open the Report: Navigate to the report you want to sign.
- Select the Lock Icon: Click the lock icon next to the study.
- Load Signature Templates: The previously created report signature templates will appear automatically.
- Select Doctor: Choose the appropriate doctor from the list to sign off the report.
- Apply Signature: The selected doctor’s signature will be applied according to the template and protocol settings.
- If PIN authentication is enabled, you will be prompted to enter the signing PIN first, then click OK to confirm.
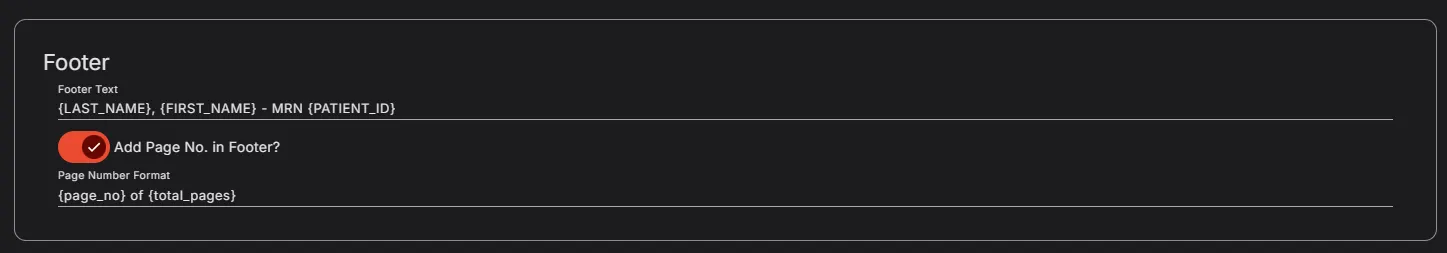
5.1.6.1.4 Footer
- Footer Text: Customizable text to appear in the footer (e.g.,
{LAST_NAME}, {FIRST_NAME}). - Add Page No. in Footer: Toggle ON/OFF to include page numbers.
- Page Number Format: Customize the format, e.g.,
{page_no} of {total_pages}to display "Page 1 of n".
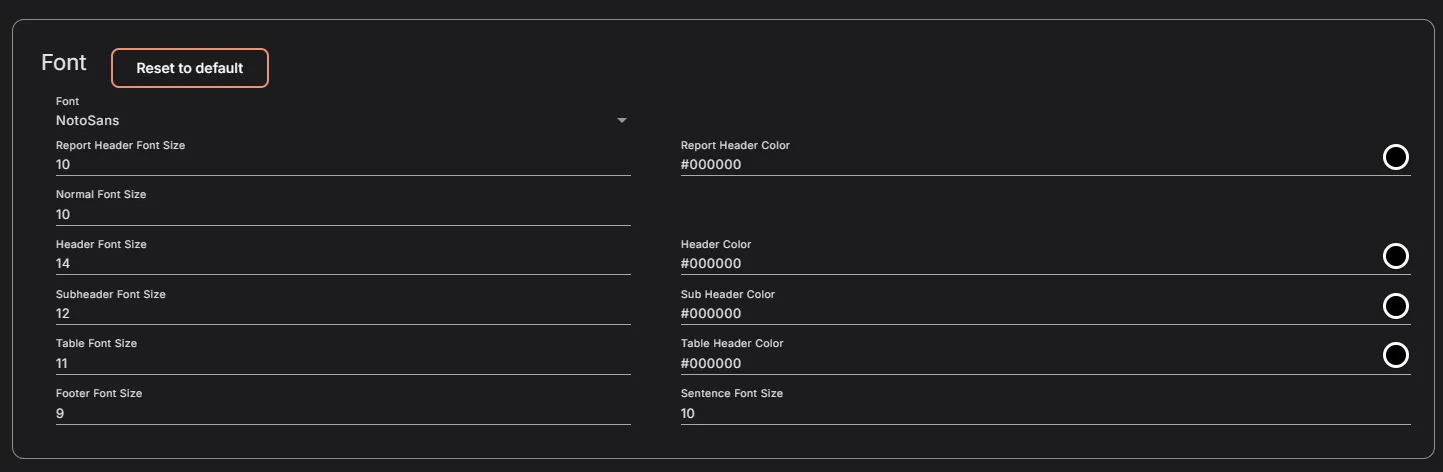
5.1.6.1.5 Font
- Font Customization: Adjust font sizes for specific sections:
- Normal Font Size: Default text size (e.g., 10).
- Header Font Size: Size for headers (e.g., 14).
- Sentence Font Size: Customize font for sentences (e.g., 10).
- Sub-header Font Size: Set the size for sub-headers (e.g., 12).
- Table Font Size: Adjust font size for tables (e.g., 11).
- Footer Font Size: Adjust font size for the footer text (e.g., 9).
- Header Color: Define the color for the main header text.
- Table Header Color: Choose the color for table header rows.
- Sub Header Color: Set the color for sub-header text elements.
- Reset to Default: Click to reset all font settings to their default values.
5.1.7 Printing a report
Click the printer icon in the header of the Report in order to print it.
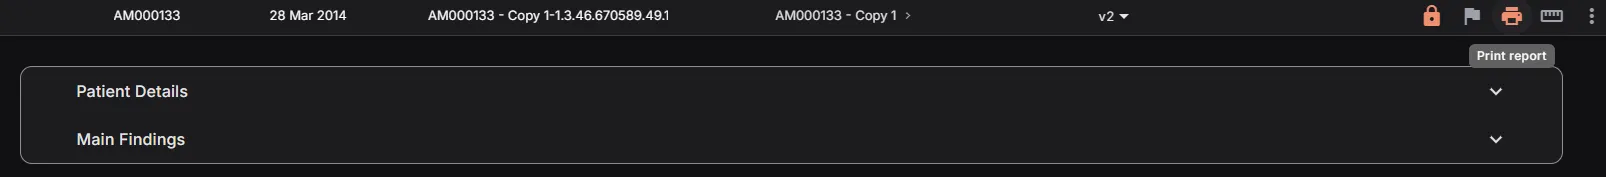
The report can be downloaded to your computer by selecting the ‘Download’ report button on the top right corner.

5.4 Editing patient information
Patient information such as name, gender and other characteristics at the top of the Report can be edited.
If there are more patient demographic details that need to be included in the report, expand the toggle to reveal the dropdown menu where you can add any other relevant details.
Once you are satisfied with the edits and additions, locate the “Save” button within the application. The “Save” button is usually found at the bottom of the screen. Click on the “Save” button to save all changes you have made to patient’s information and demographics.
If the gender of the patient has not been set, this will be indicated in the Notes field and female guideline values used to determine out of range values. Once the gender is set, this indication in the Notes field will be removed.
5.10.8 Stress Echo Protocol
Selecting the Stress Echo Protocol
To access the Stress Echo Protocol, navigate to the protocol drop-down list located at the top of your report page. From there, select 'Stress Echo Protocol' to enable the specific functionalities associated with this protocol
Conclusion for Stress Echo Result
Within the main findings section of your report, a dedicated conclusion for the stress echo result will be provided. This summary will help you interpret the findings from the stress echo procedure.
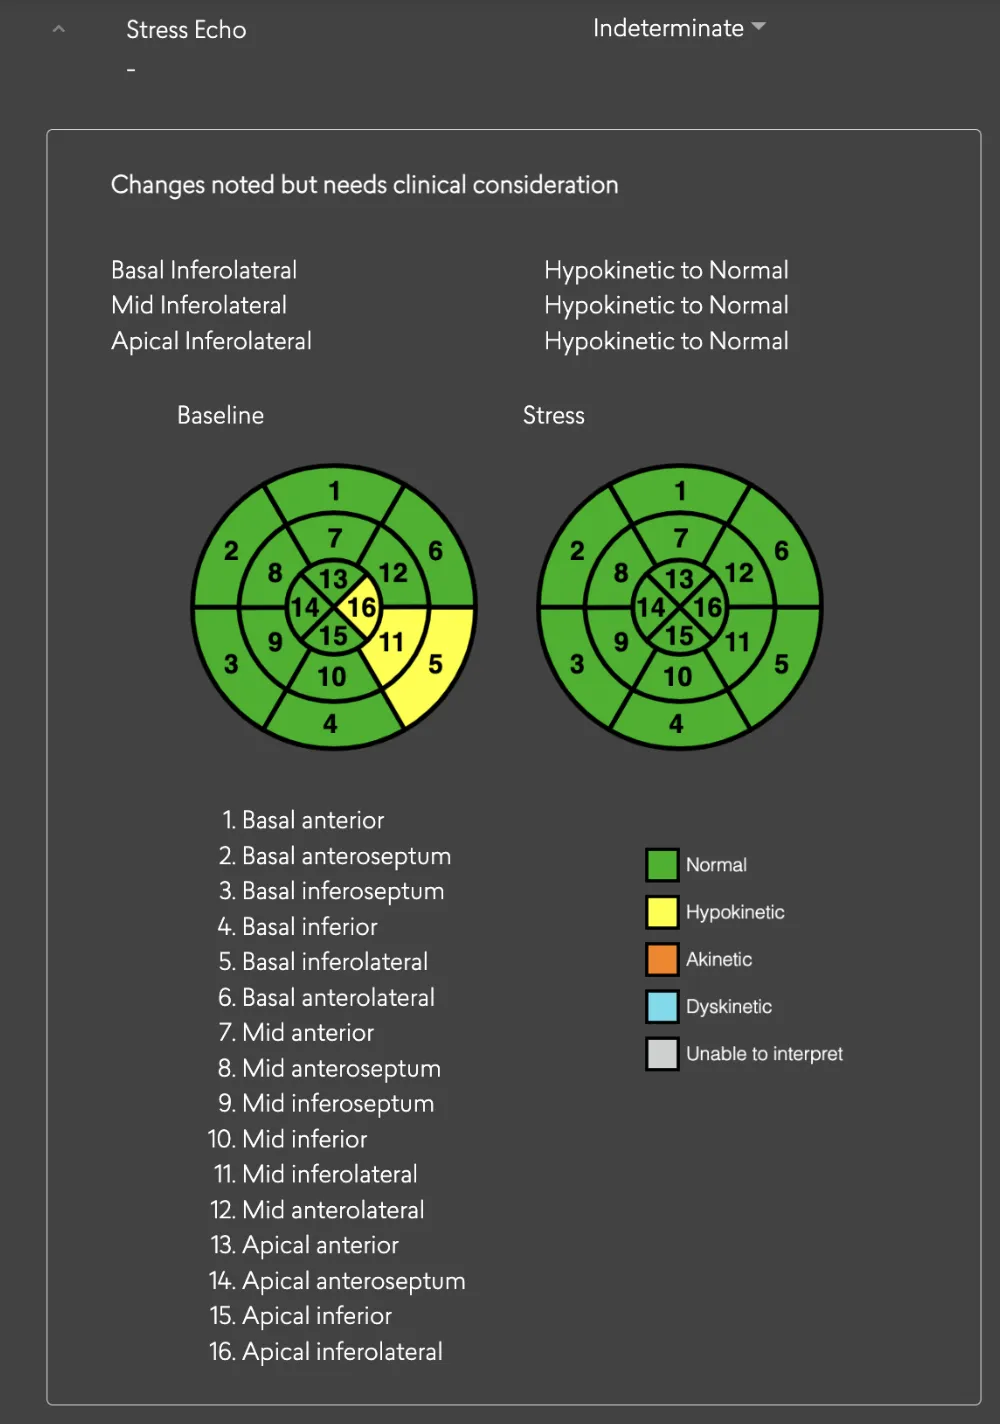
Baseline and Stress Echo Parameters
On the report page, both baseline and stress echo parameters will be accessible. This includes important metrics like RWMA (Regional Wall Motion Abnormalities) and LV systolic that are relevant to the stress echo assessment.
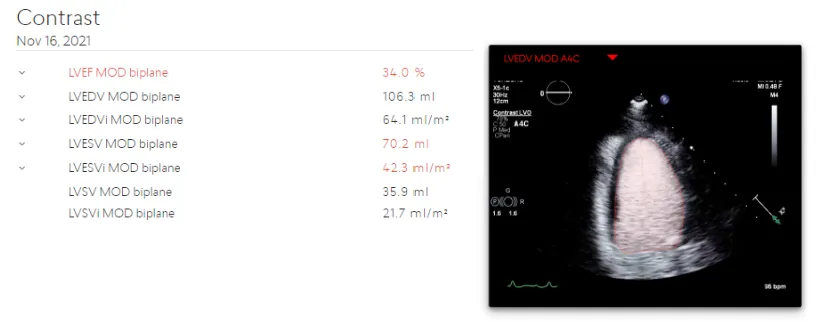
5.10.9 Contrast Echocardiography
LV Volume and LV Systolic functions as outlined in Table 2 are also available in cases where contrast echocardiography is employed. Echo parameters derived from contrast views are available on both the report and measurement pages.
5.14.6 Task overview
Free text may be input into the query through the ‘Create query’ action button with the relevant recipient, subject and message. The task overview table shows the tasks and the parameters. You may assign a particular issue to another user that is part of the project through the drop down list. You may also input free test prior to assigning the task using the “Leave a comment” field. Issues may be highlighted by selecting “Post Issue”. All identified issues with a particular task are tracked. You may select reasons for missing parameters, number of measurements to select and the measurement selection method.
5.14.7 Setup trials with preconfigured anonymized uploads
You have the ability to set up a trial account with preconfigured anonymized uploads, manage sites, import studies and assigned users to respective site IDs. It also provide visibility into the study upload status for each site.
Setup a trial with preconfigured anonymized uploads:
Navigate to the “Trial” section. Checked the box labeled “Enforce anonymization configuration”.
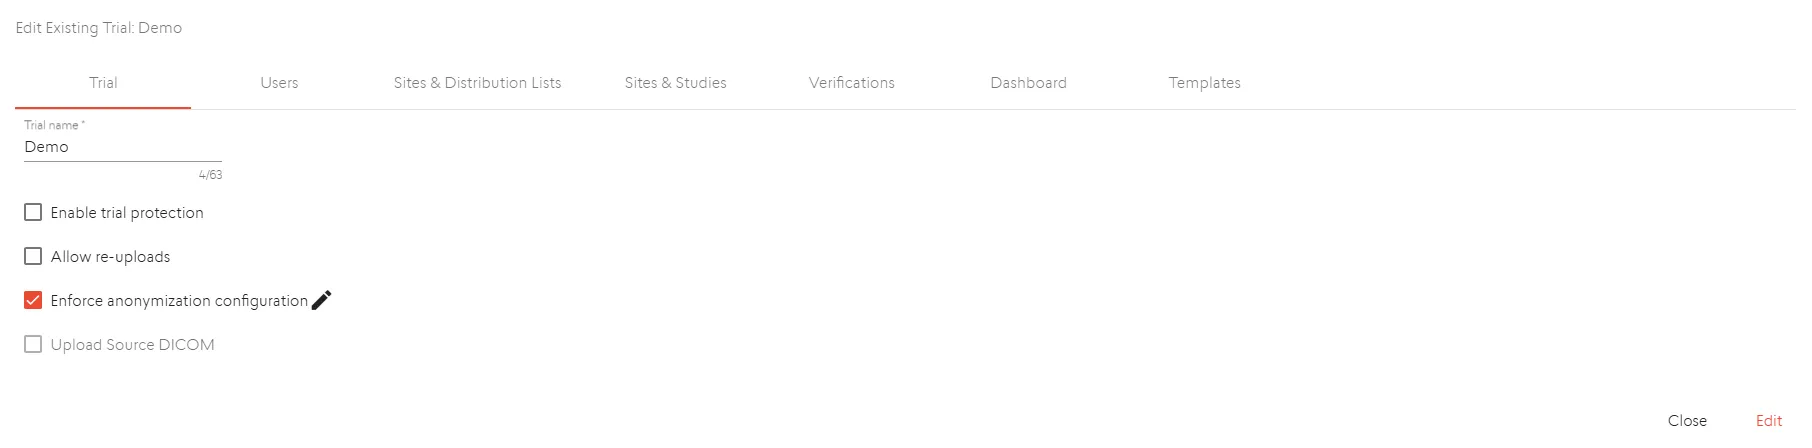
If you selected the “Enforce anonymization configuration” option, you will see an “Anonymized” section. In the “Anonymized” section, you can select which DICOM tags you want to remove, keep or pseudonymize by checking the corresponding boxes.
Sites and Studies:
Navigate to the “Sites and Studies” section. Click on the “Import Studies” button. Ensure the file format is compatible (e.g. csv).
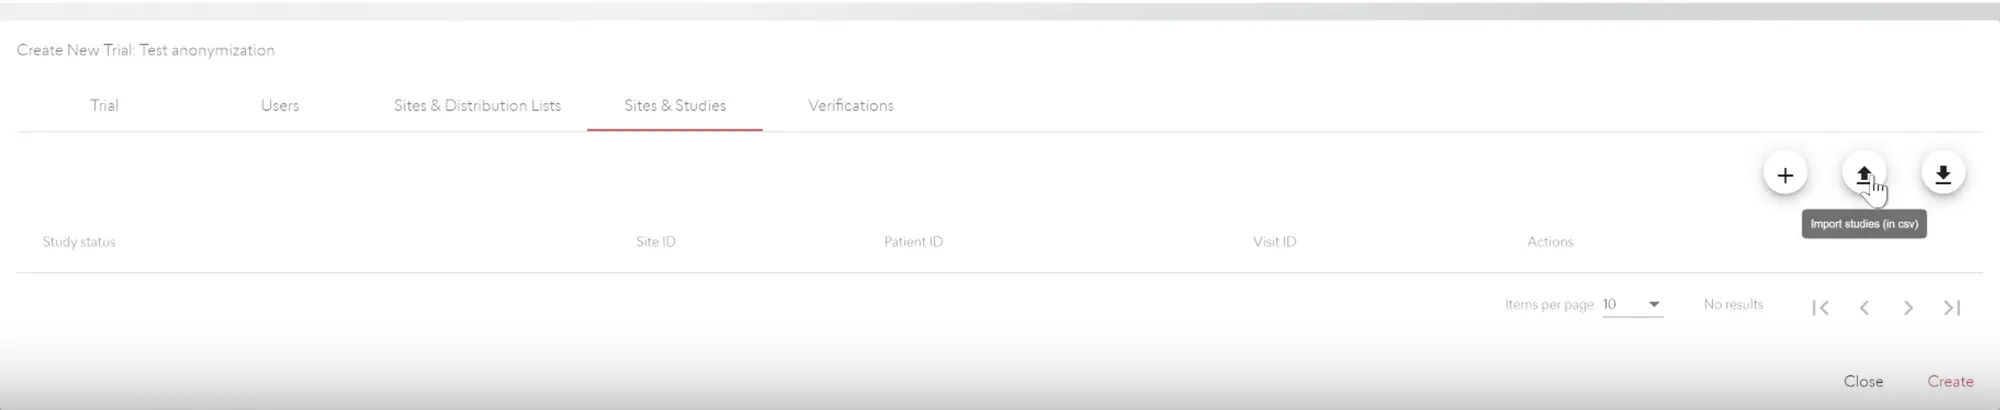
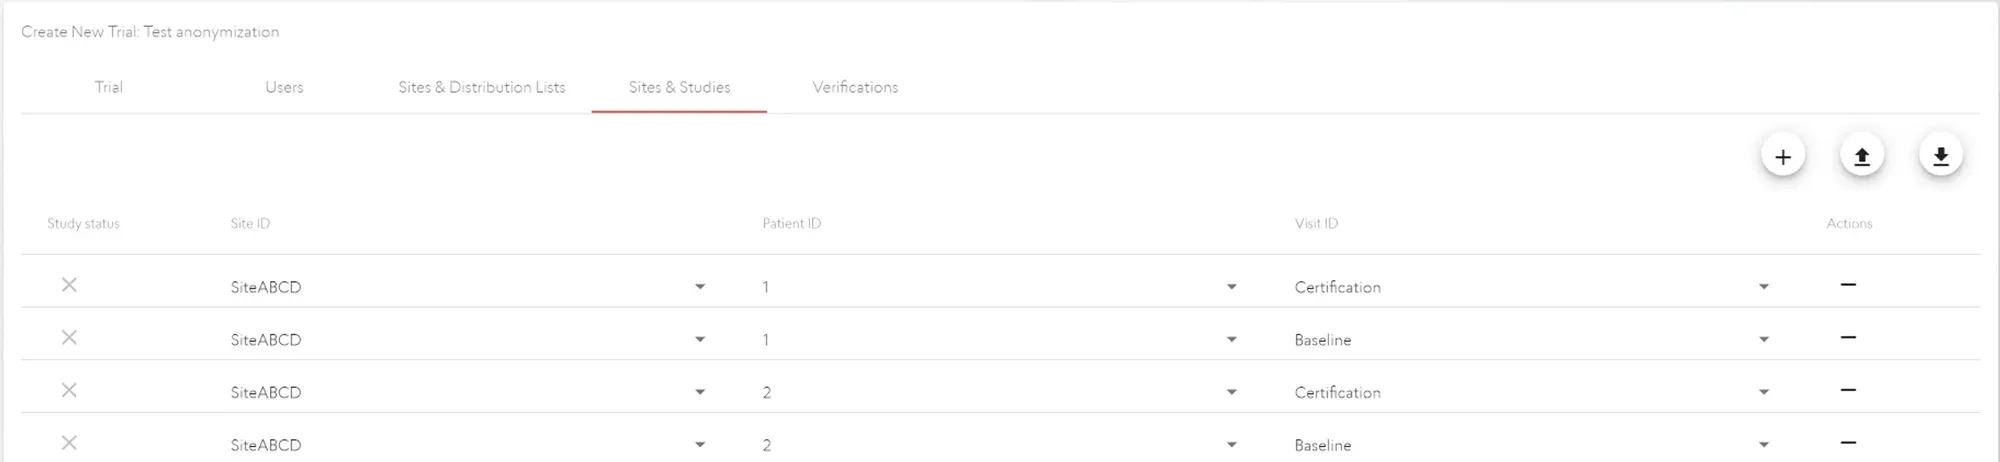
Template will be loaded automatically within the following section.
Site and Distribution:
Here you can view and rename the site IDs as needed. To rename a site ID, click on the corresponding site ID field and enter the desired new name.
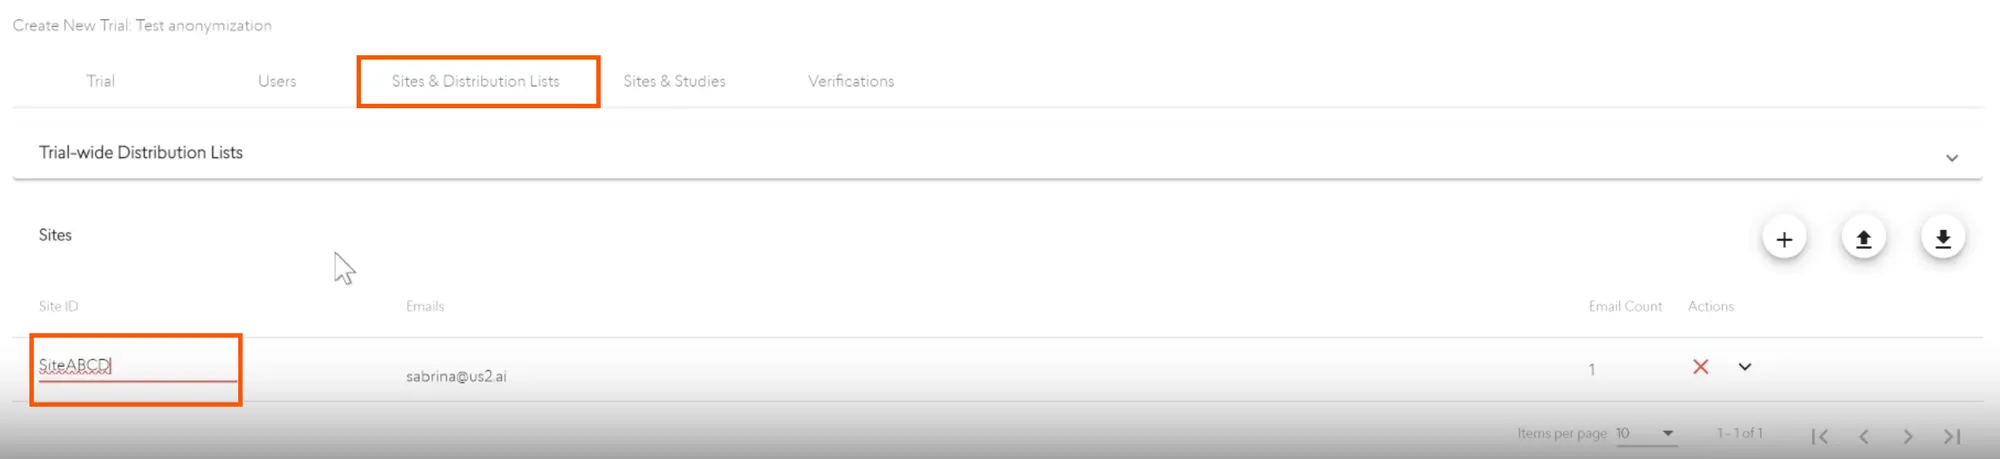
There are multiple options provided for each individual in the site to be informed about queries raised within the application.
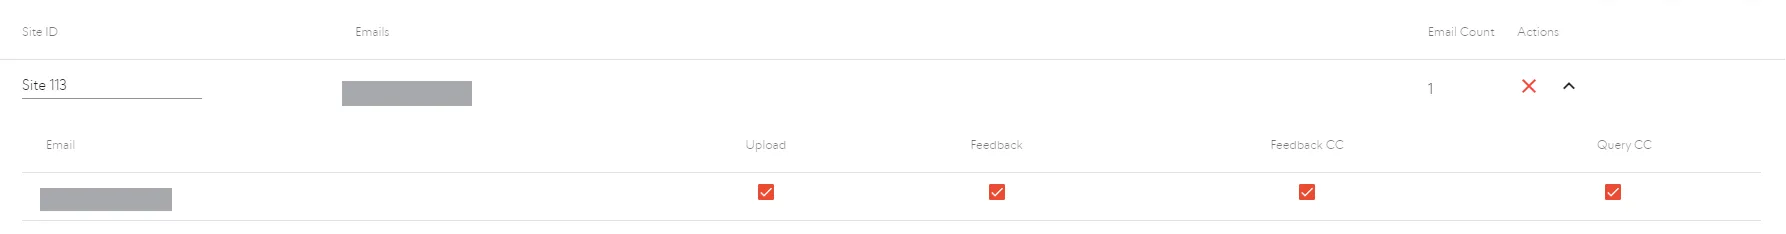
- Upload: Notify when studies are uploaded
- When a new study is successfully uploaded, the application will send a notification email to the specified email address, alerting you that a new study has been added.
- Feedback: Add to “TO” list of feedback
- The feedback study will be added to your list of feedback for follow up.
- Feedback CC: Add to “CC” list of feedback
- The specified individuals will receive a copy of the feedback study via email.
- Query CC: Add to “CC” list of query
- The specified individuals will receive a copy of the query via email.
User assignment:
Navigate to the “Users” section. In this section, you will see a list of all the registered users. Locate the user(s) you wish to assign to a specific site ID.
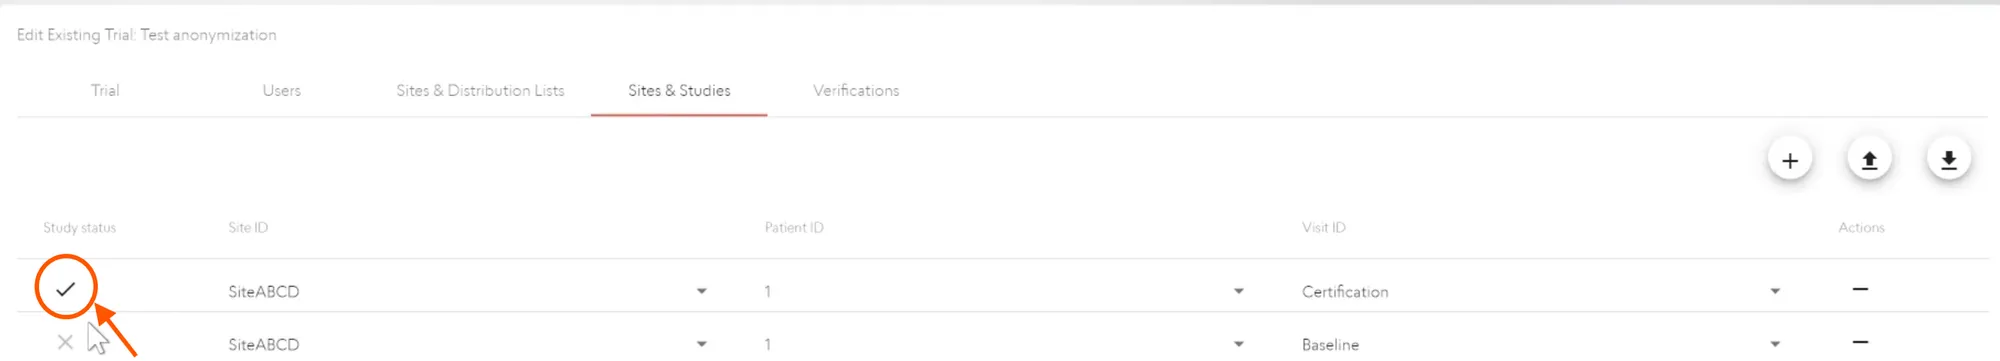
Study upload status:
When a site uploads a study through EchoLoader, the status of the upload will be automatically reflected in the “Sites and Studies” section.
If a study has been successfully uploaded for that site, a tick mark will appear next to the site ID, indicating that the site has already uploaded a certification echo. This visual indicator allows you to easily identify which sites have completed the study upload process.
6 Performance Summary
Us2.v2 is an expansion of the measurements of Us2.v1. Thus the performance of the Us2.v1 measurements are covered within the jurisdiction of Us2.v2.
The automated analysis generated by Us2.v2 will be compared head-to-head against manual analysis (of the same patient data and the same images) generated by trained echocardiography technicians or cardiologists, both in “gold standard” reference echo core labs and “real world” clinical settings. Test datasets are strictly segregated from algorithm training datasets, as they are from completely separate cohorts. Two statistical metrics, Root Mean Square Error (RMSE) and Intraclass Correlation Coefficient (ICC) are used to evaluate the performance of the Us2.v2 measurements against expert human measurements.
DICOM images from a wide variety of manufacturers were used to validate the software. DICOM metatag data available in these files contained the following manufacturer and models for the respective versions of our software:
DICOM images used for validation were captured with a variety of convex, linear and phased array probes showing an acquired frequency ranging between 1.4-10 MHz, and a Frames Per Second (FPS) range of 7- 209, with a mean of 31 from the following models, when information was available in the DICOM tags:
6.1 Us2.v1
6.2 Us2.v2
6.3 Us2.ca
Us2.ca was developed using a training dataset comprising 4,371 patients and externally validated on an independent pooled dataset of 1,647 patients. The training and external validation datasets were sourced from entirely separate data providers, ensuring no overlap and maintaining full independence between development and evaluation. The external validation cohort included a demographically and geographically diverse population, collected from six clinical sites across the United States and Japan. All echocardiographic studies were retrospectively obtained from routine clinical evaluations and provided in standard DICOM format. Ultrasound data were obtained from GE, Philips, and Siemens systems to train the machine learning-based software device, but the testing data were only obtained from GE and Philips systems.
When tested on a total of 1647 patients, Us2.ca was able to generate a confident prediction for 1434 patients (CA group: 574 patients; Controls group: 860 patients), in which Us2.ca performed with a sensitivity of 86.9% (95% CI: 84.2%-89.7%) and Specificity of 87.4% (95% CI: 85.2%-89.7%). The overall yield, which refers to the proportion of total tested patients for whom the device was able to generate a confident prediction, is sufficiently high at 87.1%.
The outcomes of the subgroup analysis are provided in the following breakdown,
Stratified by Age
| Subgroup | Primary | Analyses |
|---|---|---|
| Age | Sensitivity (%) (95% CI) | Specificity (%) (95% CI) |
| < 65 years | 78.02 (69.51, 86.53) | 88.63 (85.27, 91.99) |
| >= 65 years | 88.7 (85.87, 91.54) | 86.58 (83.63, 89.52) |
Stratified by Gender
| Subgroup | Primary | Analyses |
|---|---|---|
| Gender | Sensitivity (%) (95% CI) | Specificity (%) (95% CI) |
| Female | 85.61 (79.62, 91.59) | 87.83 (84.15, 91.5) |
| Male | 87.41 (84.3, 90.52) | 87.21 (84.43, 89.99) |
Stratified by Race
| Subgroup | Primary | Analyses |
|---|---|---|
| Race | Sensitivity (%) (95% CI) | Specificity (%) (95% CI) |
| Asian | 92.31 (88.13, 96.49) | 85.29 (80.43, 90.15) |
| African American | 85.38 (80.62, 90.13) | 87.5 (83.57, 91.43) |
| Hispanic or Latino | 100 (100, 100) | - |
| White | 83.7 (78.36, 89.03) | 88.73 (85.4, 92.06) |
| Others | 83.33 (53.51, 113.15) | 90.91 (73.92, 100) |
Stratified by Vendor
Us2.ca is externally validated on data from Philips and GE vendors.
| Subgroup | Primary | Analyses |
|---|---|---|
| Vendor | Sensitivity (%) (95% CI) | Specificity (%) (95% CI) |
| Philips | 84.17 (80.58, 87.76) | 88.42 (85.31, 91.54) |
| GE | 93.14 (89.4, 96.89) | 86.41 (83.24, 89.58) |
Stratified by Data Source
| Subgroup | Primary | Analyses |
|---|---|---|
| Data Source | Sensitivity (%) (95% CI) | Specificity (%) (95% CI) |
| Center 1 | 86.55 (82.63, 90.48) | 87.91 (85.25, 90.57) |
| Center 2 | 78.21 (69.04, 87.37) | 92.11 (83.53, 100) |
| Center 3 | 86.27 (76.83, 95.72) | 86.67 (76.73, 96.6) |
| Center 4 | 92.26 (88.05, 96.47) | 85.35 (80.43, 90.28) |
8 Manufacturer info
This software was manufactured in 2026 by Eko.ai Pte Ltd (dba Us2.ai).
Singapore
163 Tras Street, 09-04
Lian Huat building
Singapore 079024
US Agent:
Us2.ai LLC
2810 N Church St PMB 380884,
Wilmington, DE 19709, United States
New Zealand
Sponsor:
AA-Med NZ Ltd
Level 7, 54 Gill Street
New Plymouth
New Zealand
Australia:
Sponsor:
AA-Med Pty Ltd
Suite 4 Level 10
1 Chandos Street St Leonards
NSW 2065
Hong Kong
LRP:
Pharmalex BCKC (Hong Kong) Limited
LRP Address: Room 2702-03, CC WU Building, 302-8 Hennessy Road, Wanchai, HK
9 Printed user guide
Users can request a printed version of the user guide anytime by sending a request to info@Us2.ai. The document is free and will be delivered within 7 calendar days.
The following measurements are automatically calculated if the values are available,